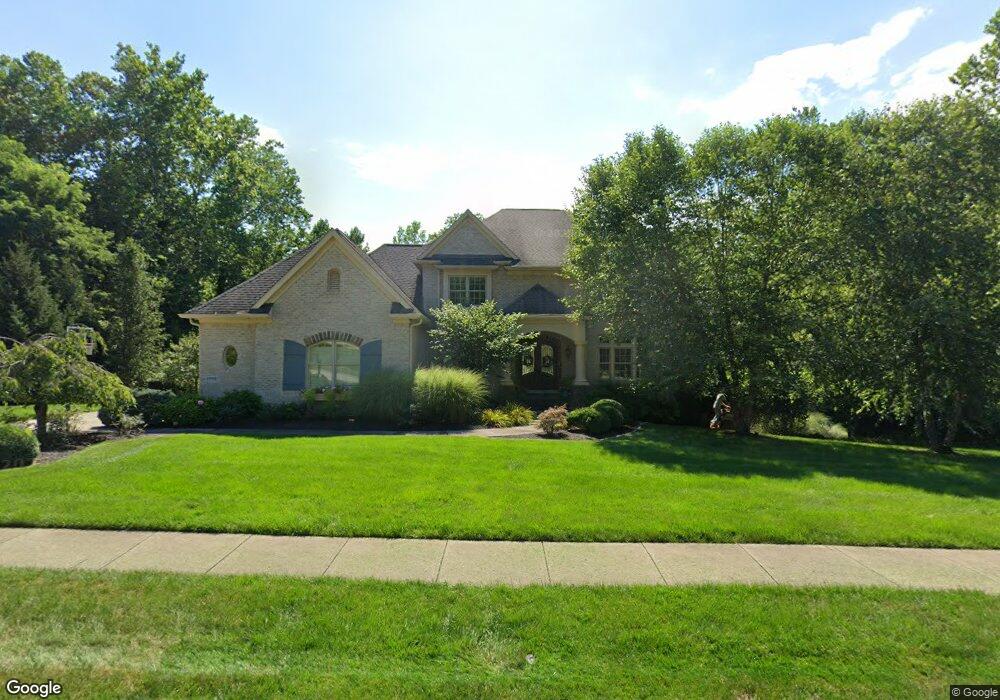
1775 Sugar Maple Place Bellbrook, OH 45305
Estimated Value: $869,566 - $1,107,000
5
Beds
3
Baths
4,518
Sq Ft
$216/Sq Ft
Est. Value
About This Home
This home is located at 1775 Sugar Maple Place, Bellbrook, OH 45305 and is currently estimated at $976,522, approximately $216 per square foot. 1775 Sugar Maple Place is a home located in Greene County with nearby schools including Bell Creek Intermediate School, Stephen Bell Elementary School, and Bellbrook Middle School.
Ownership History
Date
Name
Owned For
Owner Type
Purchase Details
Closed on
Jun 4, 2012
Sold by
Hyman Beverly Pahl
Bought by
Hyman Geoffrey J and Beverly Pahl Hyman Revocable Trust
Current Estimated Value
Purchase Details
Closed on
Jul 31, 2008
Sold by
R M Clemens Co
Bought by
Hyman Geoffrey J and Hyman Beverly Pahl
Home Financials for this Owner
Home Financials are based on the most recent Mortgage that was taken out on this home.
Original Mortgage
$417,000
Interest Rate
6.39%
Mortgage Type
Unknown
Purchase Details
Closed on
Feb 8, 2008
Sold by
Clemens Development Co
Bought by
R M Clemens Co
Create a Home Valuation Report for This Property
The Home Valuation Report is an in-depth analysis detailing your home's value as well as a comparison with similar homes in the area
Home Values in the Area
Average Home Value in this Area
Purchase History
| Date | Buyer | Sale Price | Title Company |
|---|---|---|---|
| Hyman Geoffrey J | -- | None Available | |
| Haman Beverly Pahl | -- | None Available | |
| Hyman Geoffrey J | $1,016,900 | None Available | |
| R M Clemens Co | $135,000 | None Available |
Source: Public Records
Mortgage History
| Date | Status | Borrower | Loan Amount |
|---|---|---|---|
| Previous Owner | Hyman Geoffrey J | $417,000 |
Source: Public Records
Tax History
| Year | Tax Paid | Tax Assessment Tax Assessment Total Assessment is a certain percentage of the fair market value that is determined by local assessors to be the total taxable value of land and additions on the property. | Land | Improvement |
|---|---|---|---|---|
| 2025 | $16,647 | $285,120 | $35,690 | $249,430 |
| 2024 | $16,647 | $285,120 | $35,690 | $249,430 |
| 2023 | $16,019 | $285,120 | $35,690 | $249,430 |
| 2022 | $15,303 | $222,230 | $35,690 | $186,540 |
| 2021 | $15,460 | $222,230 | $35,690 | $186,540 |
| 2020 | $14,448 | $222,230 | $35,690 | $186,540 |
| 2019 | $14,499 | $202,630 | $32,340 | $170,290 |
| 2018 | $14,515 | $202,630 | $32,340 | $170,290 |
| 2017 | $14,436 | $202,630 | $32,340 | $170,290 |
| 2016 | $14,436 | $199,820 | $32,340 | $167,480 |
| 2015 | $14,479 | $199,820 | $32,340 | $167,480 |
| 2014 | $13,412 | $199,820 | $32,340 | $167,480 |
Source: Public Records
Map
Nearby Homes
- 3634 Marwood Dr
- 3656 Persimmon Ridge Place
- 3605 Cypress Pointe Dr
- 3938 Liam Ct
- 3613 Cypress Pointe Dr
- 3604 Cypress Pointe Dr
- 3608 Cypress Pointe Dr
- 1478 Country Wood Dr
- 208 Pinegrove Dr
- 45 N East St Unit 45
- 1667 Ardennes Oak Dr
- 3617 Shellbark Dr
- 3553 Shellbark Dr
- 42 Deerpath Cir
- 2016 Wentworth Village Dr Unit 2016
- 2085 Regent Park Dr
- 1399 Heritage Trace Ct
- 2214 Hillrise Cir
- 1374 Rose Lake Dr
- 4102 Ridgetop Dr
- 1765 Sugar Maple Place
- 1791 Sugar Maple Place
- 3769 Terrace Creek Way
- 1782 Sugar Maple Place
- 1760 Sugar Maple Place
- 1799 Sugar Maple Place
- 37700 Terrace Creek Way
- A Sugar Maple Place
- Lot 1B Terrace Creek
- 3760 Terrace Creek Way
- 0 Terrace Creek Way
- 2A Terrace Creek Way
- 2 Terrace Creek Way
- 1770 Little Sugarcreek Rd
- 3770 Terrace Creek Way
- 1811 Sugar Maple Place
- 0 Little Sugarcreek Rd Unit 558766
- 1842 von Hovell Ct
- 1761 Little Sugarcreek Rd
- 1819 Sugar Maple Place
Your Personal Tour Guide
Ask me questions while you tour the home.