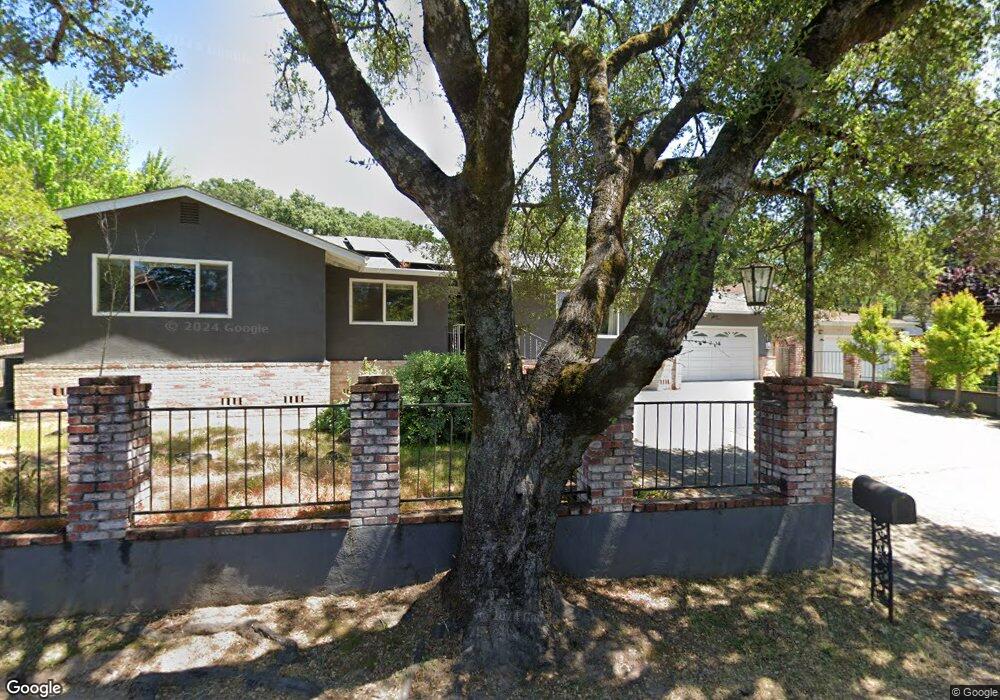
17765 Highland Blvd Sonoma, CA 95476
Estimated Value: $812,384 - $1,013,000
3
Beds
2
Baths
1,807
Sq Ft
$487/Sq Ft
Est. Value
About This Home
This home is located at 17765 Highland Blvd, Sonoma, CA 95476 and is currently estimated at $879,596, approximately $486 per square foot. 17765 Highland Blvd is a home located in Sonoma County with nearby schools including Flowery Elementary School, Adele Harrison Middle School, and Creekside High School.
Ownership History
Date
Name
Owned For
Owner Type
Purchase Details
Closed on
Jul 2, 2025
Sold by
Grant Anthony V and Grant Chandra L
Bought by
Grant Family Trust and Grant
Current Estimated Value
Purchase Details
Closed on
Jan 16, 2002
Sold by
Grant Tony and Grant Chandra L
Bought by
Grant Anthony V and Grant Chandra L
Home Financials for this Owner
Home Financials are based on the most recent Mortgage that was taken out on this home.
Original Mortgage
$240,500
Interest Rate
6.84%
Purchase Details
Closed on
Nov 26, 1997
Sold by
Exchange Bank
Bought by
Grant Tony and Grant Chandra L
Home Financials for this Owner
Home Financials are based on the most recent Mortgage that was taken out on this home.
Original Mortgage
$184,775
Interest Rate
7.31%
Purchase Details
Closed on
Feb 24, 1994
Sold by
Bercut Eva
Bought by
Wells Fargo Bank N A
Create a Home Valuation Report for This Property
The Home Valuation Report is an in-depth analysis detailing your home's value as well as a comparison with similar homes in the area
Home Values in the Area
Average Home Value in this Area
Purchase History
| Date | Buyer | Sale Price | Title Company |
|---|---|---|---|
| Grant Family Trust | -- | None Listed On Document | |
| Grant Anthony V | -- | Fidelity National Title Co | |
| Grant Tony | $194,500 | Fidelity National Title Co | |
| Wells Fargo Bank N A | $14,545 | -- |
Source: Public Records
Mortgage History
| Date | Status | Borrower | Loan Amount |
|---|---|---|---|
| Previous Owner | Grant Anthony V | $240,500 | |
| Previous Owner | Grant Tony | $184,775 |
Source: Public Records
Tax History Compared to Growth
Tax History
| Year | Tax Paid | Tax Assessment Tax Assessment Total Assessment is a certain percentage of the fair market value that is determined by local assessors to be the total taxable value of land and additions on the property. | Land | Improvement |
|---|---|---|---|---|
| 2025 | $5,039 | $310,548 | $124,540 | $186,008 |
| 2024 | $5,039 | $304,460 | $122,099 | $182,361 |
| 2023 | $5,039 | $298,491 | $119,705 | $178,786 |
| 2022 | $4,896 | $292,639 | $117,358 | $175,281 |
| 2021 | $4,664 | $286,902 | $115,057 | $171,845 |
| 2020 | $4,892 | $283,961 | $113,878 | $170,083 |
| 2019 | $4,525 | $278,395 | $111,646 | $166,749 |
| 2018 | $4,512 | $272,937 | $109,457 | $163,480 |
| 2017 | $4,177 | $267,586 | $107,311 | $160,275 |
| 2016 | $4,175 | $262,340 | $105,207 | $157,133 |
| 2015 | $3,980 | $258,400 | $103,627 | $154,773 |
| 2014 | $3,897 | $253,340 | $101,598 | $151,742 |
Source: Public Records
Map
Nearby Homes
- 17641 Highland Blvd
- 17538 Highland Blvd
- 17560 Middlefield Rd
- 17621 Sunset Way
- 18010 Highway 12
- 350 Calle Del Monte None
- 17364 Hillside Ave
- 17285 Hillcrest Ave
- 18070 Myrtle Ave
- 1195 Alberca Rd
- 311 Dechene Ave
- 18350 Sierra Dr
- 18327 Sierra Dr
- 18418 1st Ave
- 1228 Los Robles Dr
- 18445 1st Ave
- 18346 Happy Ln
- 18039 Riverside Dr
- 18004 Riverside Dr
- 60 Rancho Dr Unit 60
- 17779 Highland Blvd
- 17783 Highland Blvd
- 17649 Highland Blvd
- 85 Waterman Ave
- 17700 Highland Blvd
- 17648 Highland Blvd
- 17644 Highland Blvd
- 70 Waterman Ave
- 17845 Highland Blvd
- 17634 Highlands Blvd
- 17651 Middlefield Rd
- 65 Waterman Ave
- 17645 Middlefield Rd
- 17830 Highland Blvd
- 17639 Middlefield Rd
- 17600 Highland Blvd
- 60 Waterman Ave
- 18635 Middlefield Rd
- 155 Rose Ave
- 17840 Highland Blvd