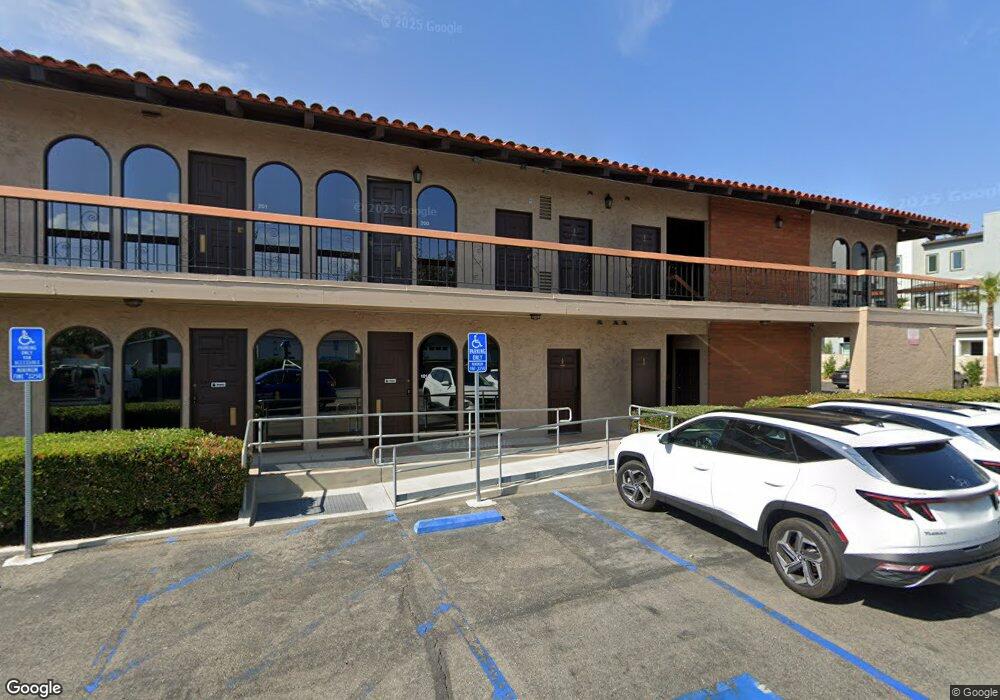
17772 Irvine Blvd Unit 205_2 Tustin, CA 92780
Estimated Value: $5,056,238
--
Bed
--
Bath
17,542
Sq Ft
$288/Sq Ft
Est. Value
About This Home
This home is located at 17772 Irvine Blvd Unit 205_2, Tustin, CA 92780 and is currently estimated at $5,056,238, approximately $288 per square foot. 17772 Irvine Blvd Unit 205_2 is a home located in Orange County with nearby schools including Guin Foss Elementary School, Columbus Tustin Middle School, and Foothill High School.
Ownership History
Date
Name
Owned For
Owner Type
Purchase Details
Closed on
Oct 23, 2023
Sold by
Golden Top Llc
Bought by
Tustin 40 Development Llc
Current Estimated Value
Purchase Details
Closed on
Apr 15, 2020
Sold by
R & B Investments Lp
Bought by
Golden Top Llc
Home Financials for this Owner
Home Financials are based on the most recent Mortgage that was taken out on this home.
Original Mortgage
$1,637,500
Interest Rate
3.2%
Mortgage Type
Future Advance Clause Open End Mortgage
Purchase Details
Closed on
Jan 18, 2001
Sold by
Miller Robert Franklin and Miller Beverly Blake
Bought by
Boelter Karen Ann and Miller Grant John
Purchase Details
Closed on
May 27, 1999
Sold by
Ninburg Daniel H
Bought by
Ninburg Md Daniel H
Purchase Details
Closed on
Apr 19, 1996
Sold by
Miller Robert Franklin and Miller Beverly Blake
Bought by
Miller Robert Franklin and Miller Beverly Blake
Create a Home Valuation Report for This Property
The Home Valuation Report is an in-depth analysis detailing your home's value as well as a comparison with similar homes in the area
Home Values in the Area
Average Home Value in this Area
Purchase History
| Date | Buyer | Sale Price | Title Company |
|---|---|---|---|
| Tustin 40 Development Llc | -- | First American Title | |
| Golden Top Llc | $3,275,000 | First Amer Ttl Ins Co Natl C | |
| Boelter Karen Ann | -- | -- | |
| R & B Investments Lp | -- | -- | |
| Ninburg Md Daniel H | -- | North American Title Co | |
| Miller Robert Franklin | -- | -- | |
| Miller Robert Franklin | -- | -- |
Source: Public Records
Mortgage History
| Date | Status | Borrower | Loan Amount |
|---|---|---|---|
| Previous Owner | Golden Top Llc | $1,637,500 |
Source: Public Records
Tax History Compared to Growth
Tax History
| Year | Tax Paid | Tax Assessment Tax Assessment Total Assessment is a certain percentage of the fair market value that is determined by local assessors to be the total taxable value of land and additions on the property. | Land | Improvement |
|---|---|---|---|---|
| 2025 | $41,035 | $3,581,690 | $2,515,387 | $1,066,303 |
| 2024 | $41,035 | $3,511,461 | $2,466,065 | $1,045,396 |
| 2023 | $40,018 | $3,442,609 | $2,417,710 | $1,024,899 |
| 2022 | $39,398 | $3,375,107 | $2,370,304 | $1,004,803 |
| 2021 | $38,619 | $3,308,929 | $2,323,828 | $985,101 |
| 2020 | $30,648 | $2,552,024 | $859,038 | $1,692,986 |
| 2019 | $29,929 | $2,501,985 | $842,194 | $1,659,791 |
| 2018 | $29,452 | $2,452,927 | $825,680 | $1,627,247 |
| 2017 | $28,952 | $2,404,831 | $809,490 | $1,595,341 |
| 2016 | $28,448 | $2,357,678 | $793,618 | $1,564,060 |
| 2015 | $28,962 | $2,322,264 | $781,697 | $1,540,567 |
| 2014 | $28,244 | $2,276,775 | $766,385 | $1,510,390 |
Source: Public Records
Map
Nearby Homes
- 119 Jessup Way
- 139 Jessup Way
- 282 Prospect Park
- 453 E 1st St
- 160 N B St
- 17902 Lucero Way
- 17841 Lucero Way
- 14732 Candeda Place
- 17601 Sherbrook Dr
- 157 Pacific St
- 17771 Orange Tree Ln
- 14291 Prospect Ave
- 1042 San Juan St
- 18101 Kirk Ave
- 1125 E 1st St
- 1091 Bonita St
- 1111 Packers Cir Unit 25
- 654 W Main St Unit B
- 1161 Packers Cir Unit 102
- 631 W 6th St Unit D
- 17772 Irvine Blvd Unit 213
- 17772 Irvine Blvd Unit 207
- 17772 Irvine Blvd Unit 205_4
- 17772 Irvine Blvd Unit 205_3
- 17772 Irvine Blvd Unit 102-6
- 17772 Irvine Blvd
- 17772 Irvine Blvd Unit 101
- 17772 Irvine Blvd Unit 102-4
- 17772 Irvine Blvd Unit 209-210
- 17772 Irvine Blvd Unit 102-8
- 17772 Irvine Blvd Unit 211
- 17772 Irvine Blvd Unit 102-7
- 17772 Irvine Blvd Unit 200
- 222 Prospect Park
- 212 Prospect Park
- 202 Prospect Park
- 195 Orangewood Ln
- 232 Prospect Park
- 242 Prospect Park
- 252 Prospect Park