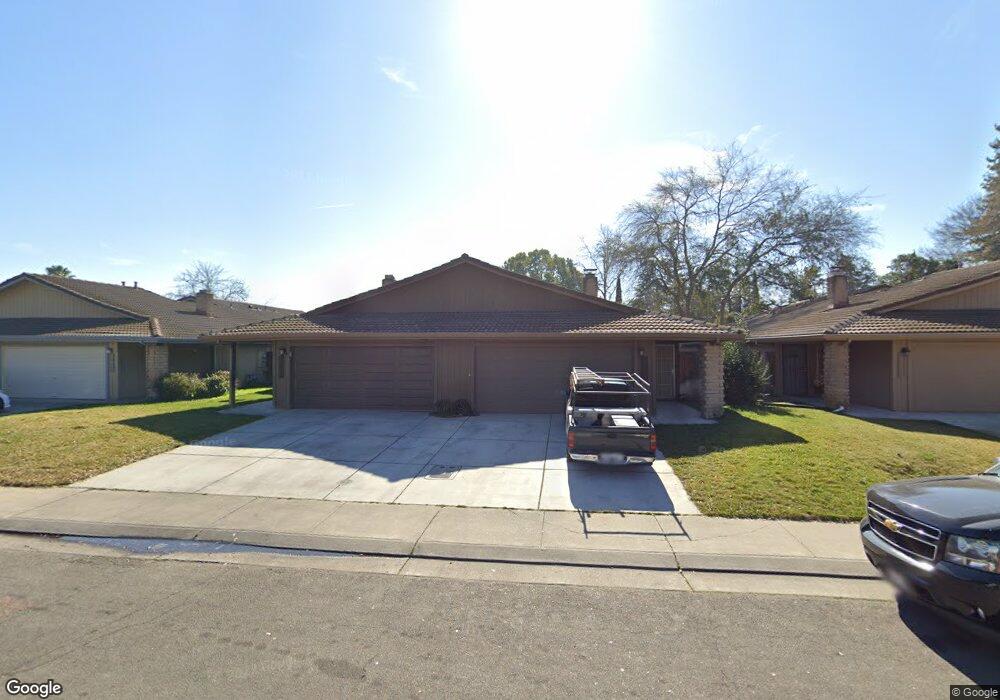
1778 Long Barn Way Stockton, CA 95207
Lincoln Village NeighborhoodEstimated Value: $557,332 - $643,000
12
Beds
8
Baths
2,721
Sq Ft
$221/Sq Ft
Est. Value
About This Home
This home is located at 1778 Long Barn Way, Stockton, CA 95207 and is currently estimated at $600,583, approximately $220 per square foot. 1778 Long Barn Way is a home located in San Joaquin County with nearby schools including Flora Arca Mata, Madison Elementary School, and Hoover Elementary School.
Ownership History
Date
Name
Owned For
Owner Type
Purchase Details
Closed on
Oct 30, 2017
Sold by
Chase Lori Suzanne and Gifford Christopher Lee
Bought by
Estay Luis M and Estay Norma
Current Estimated Value
Home Financials for this Owner
Home Financials are based on the most recent Mortgage that was taken out on this home.
Original Mortgage
$274,400
Outstanding Balance
$229,813
Interest Rate
3.83%
Mortgage Type
New Conventional
Estimated Equity
$370,770
Purchase Details
Closed on
May 1, 2012
Sold by
Gifford Patti A
Bought by
The Patti Ann Gifford Revocable Living T
Purchase Details
Closed on
Feb 26, 2009
Sold by
Toy Jana Louise
Bought by
Toy Sammy G
Purchase Details
Closed on
Mar 25, 2002
Sold by
Gifford Patti A
Bought by
Gifford Patti A
Home Financials for this Owner
Home Financials are based on the most recent Mortgage that was taken out on this home.
Original Mortgage
$90,000
Interest Rate
6.78%
Mortgage Type
Purchase Money Mortgage
Create a Home Valuation Report for This Property
The Home Valuation Report is an in-depth analysis detailing your home's value as well as a comparison with similar homes in the area
Home Values in the Area
Average Home Value in this Area
Purchase History
| Date | Buyer | Sale Price | Title Company |
|---|---|---|---|
| Estay Luis M | $343,000 | Chicago Title Company | |
| The Patti Ann Gifford Revocable Living T | -- | None Available | |
| Toy Sammy G | -- | North American Title Company | |
| Gifford Patti A | -- | First American Title Co |
Source: Public Records
Mortgage History
| Date | Status | Borrower | Loan Amount |
|---|---|---|---|
| Open | Estay Luis M | $274,400 | |
| Previous Owner | Gifford Patti A | $90,000 |
Source: Public Records
Tax History Compared to Growth
Tax History
| Year | Tax Paid | Tax Assessment Tax Assessment Total Assessment is a certain percentage of the fair market value that is determined by local assessors to be the total taxable value of land and additions on the property. | Land | Improvement |
|---|---|---|---|---|
| 2025 | $4,774 | $390,271 | $113,781 | $276,490 |
| 2024 | $4,697 | $382,619 | $111,550 | $271,069 |
| 2023 | $4,590 | $375,117 | $109,363 | $265,754 |
| 2022 | $4,494 | $367,763 | $107,219 | $260,544 |
| 2021 | $4,317 | $360,553 | $105,117 | $255,436 |
| 2020 | $4,400 | $356,857 | $104,040 | $252,817 |
| 2019 | $4,382 | $349,860 | $102,000 | $247,860 |
| 2018 | $1,715 | $139,054 | $18,270 | $120,784 |
| 2017 | $1,710 | $136,328 | $17,912 | $118,416 |
| 2016 | $1,740 | $133,654 | $17,560 | $116,094 |
| 2014 | $1,653 | $129,069 | $16,958 | $112,111 |
Source: Public Records
Map
Nearby Homes
- 1834 Venetian Dr
- 5618 Cascade Ct
- 1902 Venetian Dr
- 2034 Venetian Dr
- 1443 San Rocco Cir
- 2005 Cedar Ridge Dr
- 2009 Cedar Ridge Dr
- 5215 Grouse Run Dr
- 5330 Covey Creek Cir
- 1548 Griffin Point
- 4985 Gadwall Cir
- 1929 W Swain Rd
- 2128 Canyon Creek Dr
- 5021 Gadwall Cir
- 1707 W Swain Rd Unit 5
- 1947 Rosecrans Way
- 2329 Lido Cir
- 2433 Pheasant Run Cir
- 1417 W Swain Rd
- 2252 Canyon Creek Dr
- 1786 Long Barn Way
- 1770 Long Barn Way
- 1788 Long Barn Way
- 1762 Long Barn Way
- 1723 Veronese Way
- 1794 Long Barn Way
- 5504 Passero Way
- 1796 Long Barn Way
- 1715 Veronese Way
- 5456 Passero Way
- 1779 Long Barn Way
- 1771 Long Barn Way
- 1787 Long Barn Way
- 1754 Long Barn Way
- 1763 Long Barn Way
- 1707 Veronese Way
- 5444 Passero Way
- 1795 Long Barn Way
- 1749 Long Barn Way
- 16 Passero Way