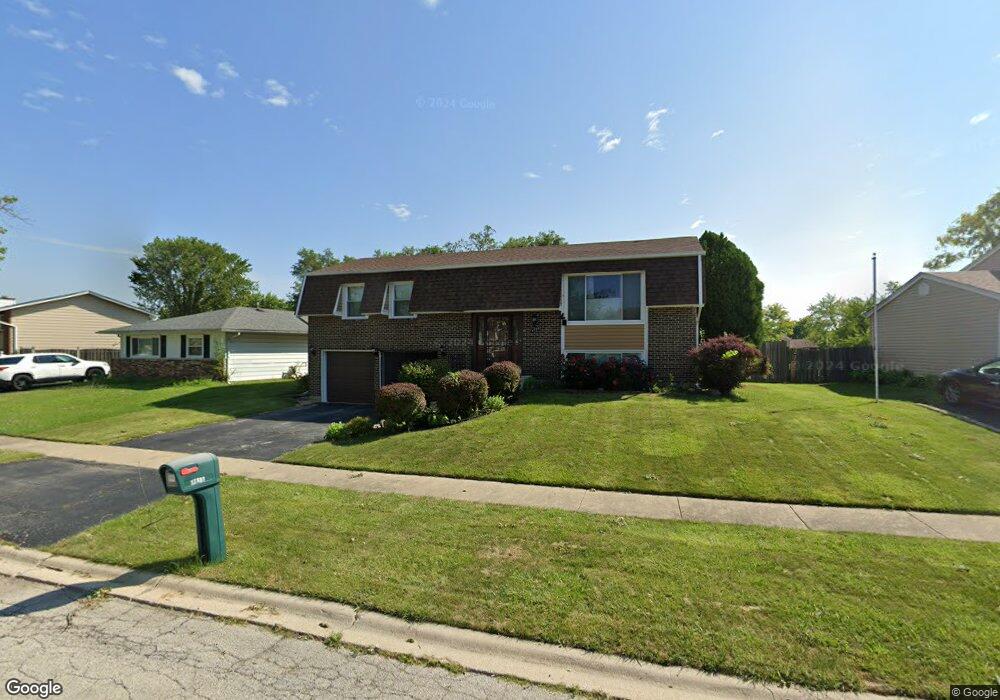
17781 Sarah Ln Country Club Hills, IL 60478
Estimated Value: $212,000 - $250,000
4
Beds
2
Baths
1,271
Sq Ft
$183/Sq Ft
Est. Value
About This Home
This home is located at 17781 Sarah Ln, Country Club Hills, IL 60478 and is currently estimated at $233,191, approximately $183 per square foot. 17781 Sarah Ln is a home located in Cook County with nearby schools including Chateaux School, Prairie-Hills Junior High School, and Hillcrest High School.
Ownership History
Date
Name
Owned For
Owner Type
Purchase Details
Closed on
Feb 1, 1999
Sold by
Johnson Bernice
Bought by
Brunt Debra D
Current Estimated Value
Home Financials for this Owner
Home Financials are based on the most recent Mortgage that was taken out on this home.
Original Mortgage
$99,744
Outstanding Balance
$23,751
Interest Rate
6.81%
Mortgage Type
FHA
Estimated Equity
$209,440
Purchase Details
Closed on
Jan 28, 1995
Sold by
Johnson Stevan
Bought by
Johnson Bernice
Purchase Details
Closed on
Sep 9, 1993
Sold by
Coleman Cheryl Lynn and Coleman Juan D
Bought by
Johnson Bernice and Johnson Stevan
Home Financials for this Owner
Home Financials are based on the most recent Mortgage that was taken out on this home.
Original Mortgage
$36,000
Interest Rate
7.22%
Create a Home Valuation Report for This Property
The Home Valuation Report is an in-depth analysis detailing your home's value as well as a comparison with similar homes in the area
Home Values in the Area
Average Home Value in this Area
Purchase History
| Date | Buyer | Sale Price | Title Company |
|---|---|---|---|
| Brunt Debra D | $100,000 | -- | |
| Johnson Bernice | -- | -- | |
| Johnson Bernice | -- | -- |
Source: Public Records
Mortgage History
| Date | Status | Borrower | Loan Amount |
|---|---|---|---|
| Open | Brunt Debra D | $99,744 | |
| Previous Owner | Johnson Bernice | $36,000 | |
| Closed | Brunt Debra D | $3,989 |
Source: Public Records
Tax History Compared to Growth
Tax History
| Year | Tax Paid | Tax Assessment Tax Assessment Total Assessment is a certain percentage of the fair market value that is determined by local assessors to be the total taxable value of land and additions on the property. | Land | Improvement |
|---|---|---|---|---|
| 2024 | $8,239 | $19,000 | $2,687 | $16,313 |
| 2023 | $5,111 | $19,000 | $2,687 | $16,313 |
| 2022 | $5,111 | $10,311 | $2,303 | $8,008 |
| 2021 | $5,084 | $10,310 | $2,302 | $8,008 |
| 2020 | $5,084 | $10,310 | $2,302 | $8,008 |
| 2019 | $4,747 | $10,041 | $2,110 | $7,931 |
| 2018 | $4,568 | $10,041 | $2,110 | $7,931 |
| 2017 | $4,432 | $10,041 | $2,110 | $7,931 |
| 2016 | $4,317 | $8,833 | $1,919 | $6,914 |
| 2015 | $4,068 | $8,833 | $1,919 | $6,914 |
| 2014 | $3,883 | $10,417 | $1,919 | $8,498 |
| 2013 | $5,242 | $11,689 | $1,919 | $9,770 |
Source: Public Records
Map
Nearby Homes
- 17721 Sarah Ln
- 3761 Kirk Ct
- 7R2 Country Club Ln
- 3651 177th St
- 7R3 Country Club Ln
- 3740 Highland Place
- 3861 178th Place
- 17651 Hillcrest Dr
- 17617 Central Park Ave
- 17710 Harvard Ln
- 17640 Central Park Ave
- 17861 Harvard Ln
- 17700 Springfield Ave
- 3617 175th Place
- 17511 Winston Dr Unit 1
- 17700 Oakwood Ave
- 17963 Amherst Ct Unit 102
- 17975 Amherst Ct Unit 301
- 17922 Normandy Ln
- 18018 Chantilly Ln Unit S3
- 17771 Sarah Ln
- 17791 Sarah Ln
- 17761 Sarah Ln
- 17760 Pheasant Ln
- 17801 Sarah Ln
- 17770 Pheasant Ln
- 17750 Pheasant Ln
- 17780 Pheasant Ln
- 17790 Sarah Ln
- 17780 Sarah Ln
- 17751 Sarah Ln
- 17811 Sarah Ln
- 17800 Sarah Ln
- 17770 Sarah Ln
- 17740 Pheasant Ln
- 17810 Sarah Ln
- 17790 Pheasant Ln
- 17760 Sarah Ln
- 17741 Sarah Ln
- 17810 Central Park Ave