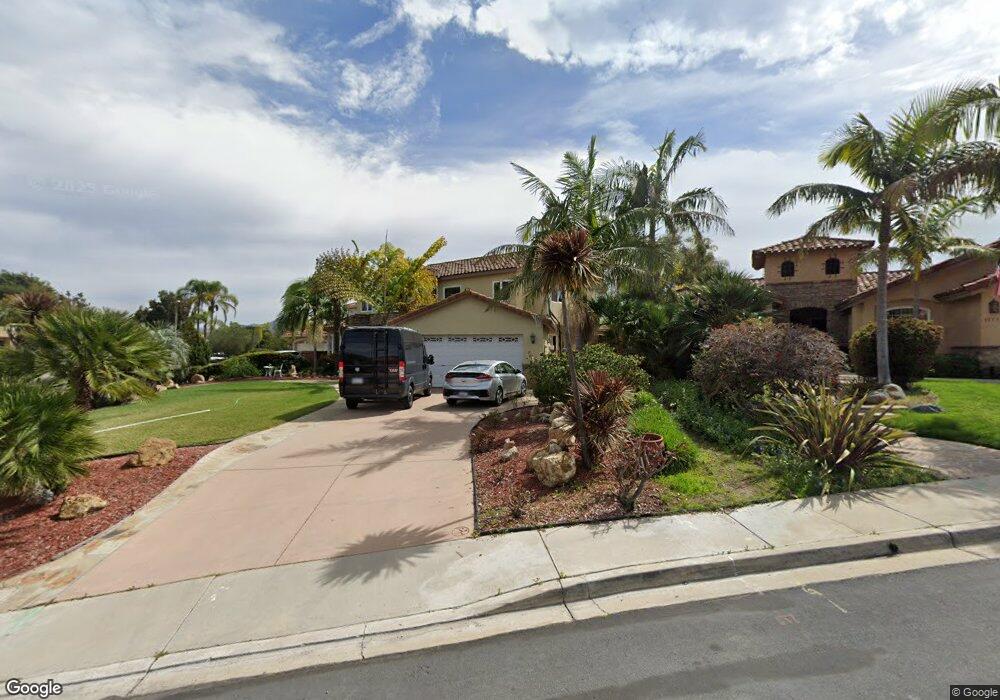
17787 Creciente Way San Diego, CA 92127
Rancho Bernardo NeighborhoodEstimated Value: $1,551,000 - $1,767,677
4
Beds
4
Baths
2,880
Sq Ft
$579/Sq Ft
Est. Value
About This Home
This home is located at 17787 Creciente Way, San Diego, CA 92127 and is currently estimated at $1,667,169, approximately $578 per square foot. 17787 Creciente Way is a home located in San Diego County with nearby schools including Westwood Elementary School, Bernardo Heights Middle, and Rancho Bernardo High.
Ownership History
Date
Name
Owned For
Owner Type
Purchase Details
Closed on
May 12, 2011
Sold by
Lachenbruch Daniel B
Bought by
Lachenbruch Daniel B
Current Estimated Value
Purchase Details
Closed on
Jun 15, 2007
Sold by
Lachenbruch Ann F
Bought by
Lachenbruch Daniel B
Purchase Details
Closed on
Feb 19, 2002
Sold by
Lachenbruch Daniel B and Lachenbruch Ann F
Bought by
Lachenbruch Daniel B and Lachenbruch Ann F
Home Financials for this Owner
Home Financials are based on the most recent Mortgage that was taken out on this home.
Original Mortgage
$189,000
Interest Rate
6.8%
Purchase Details
Closed on
Nov 30, 1999
Sold by
Bondie Delberta Jane
Bought by
Lachenbruch Daniel B and Entress Ann F
Home Financials for this Owner
Home Financials are based on the most recent Mortgage that was taken out on this home.
Original Mortgage
$200,000
Interest Rate
7.96%
Purchase Details
Closed on
Mar 21, 1985
Create a Home Valuation Report for This Property
The Home Valuation Report is an in-depth analysis detailing your home's value as well as a comparison with similar homes in the area
Home Values in the Area
Average Home Value in this Area
Purchase History
| Date | Buyer | Sale Price | Title Company |
|---|---|---|---|
| Lachenbruch Daniel B | -- | None Available | |
| Lachenbruch Daniel B | -- | None Available | |
| Lachenbruch Daniel B | -- | Lawyers Title | |
| Lachenbruch Daniel B | $330,000 | California Title | |
| -- | $159,000 | -- |
Source: Public Records
Mortgage History
| Date | Status | Borrower | Loan Amount |
|---|---|---|---|
| Closed | Lachenbruch Daniel B | $189,000 | |
| Closed | Lachenbruch Daniel B | $200,000 |
Source: Public Records
Tax History Compared to Growth
Tax History
| Year | Tax Paid | Tax Assessment Tax Assessment Total Assessment is a certain percentage of the fair market value that is determined by local assessors to be the total taxable value of land and additions on the property. | Land | Improvement |
|---|---|---|---|---|
| 2025 | $7,533 | $684,633 | $113,829 | $570,804 |
| 2024 | $7,533 | $671,210 | $111,598 | $559,612 |
| 2023 | $7,372 | $658,050 | $109,410 | $548,640 |
| 2022 | $7,248 | $645,148 | $107,265 | $537,883 |
| 2021 | $7,152 | $632,499 | $105,162 | $527,337 |
| 2020 | $7,055 | $626,014 | $104,084 | $521,930 |
| 2019 | $6,871 | $613,741 | $102,044 | $511,697 |
| 2018 | $6,676 | $601,708 | $100,044 | $501,664 |
| 2017 | $83 | $589,911 | $98,083 | $491,828 |
| 2016 | $6,362 | $578,345 | $96,160 | $482,185 |
| 2015 | $6,267 | $569,659 | $94,716 | $474,943 |
| 2014 | $6,118 | $558,501 | $92,861 | $465,640 |
Source: Public Records
Map
Nearby Homes
- 17892 Creciente Way
- 18103 Smokesignal Dr
- 17924 Cabela Dr
- 11515 Escoba Place
- 17885 Caminito Pinero Unit 255
- 17544 Ashburton Rd
- 18650 Caminito Cantilena Unit 291
- 11915 Fairhope Rd
- 18557 Caminito Pasadero Unit 389
- 18515 Caminito Pasadero Unit 347
- 11364 Poblado Rd
- 18752 Caminito Cantilena Unit 176
- 11864 Bernardo Terrace Unit C
- 17165 W Bernardo Dr Unit 205
- 17185 W Bernardo Dr Unit 203
- 17195 W Bernardo Dr Unit 206
- 17141 W Bernardo Dr Unit 204
- 17093 W Bernardo Dr Unit 202
- 17093 W Bernardo Dr Unit 205
- 18812 Caminito Cantilena Unit 124
- 17777 Creciente Way
- 11323 Creciente Ct
- 17767 Creciente Way
- 17872 Azucar Way
- 17864 Azucar Way
- 17788 Creciente Way
- 17796 Creciente Way
- 17757 Creciente Way
- 17880 Azucar Way
- 17856 Azucar Way
- 11333 Creciente Ct
- 11334 Creciente Ct
- 17804 Creciente Way
- 17772 Creciente Way
- 11324 Creciente Ct
- 17747 Creciente Way
- 17848 Azucar Way
- 17812 Creciente Way
- 17888 Azucar Way
- 17764 Creciente Way