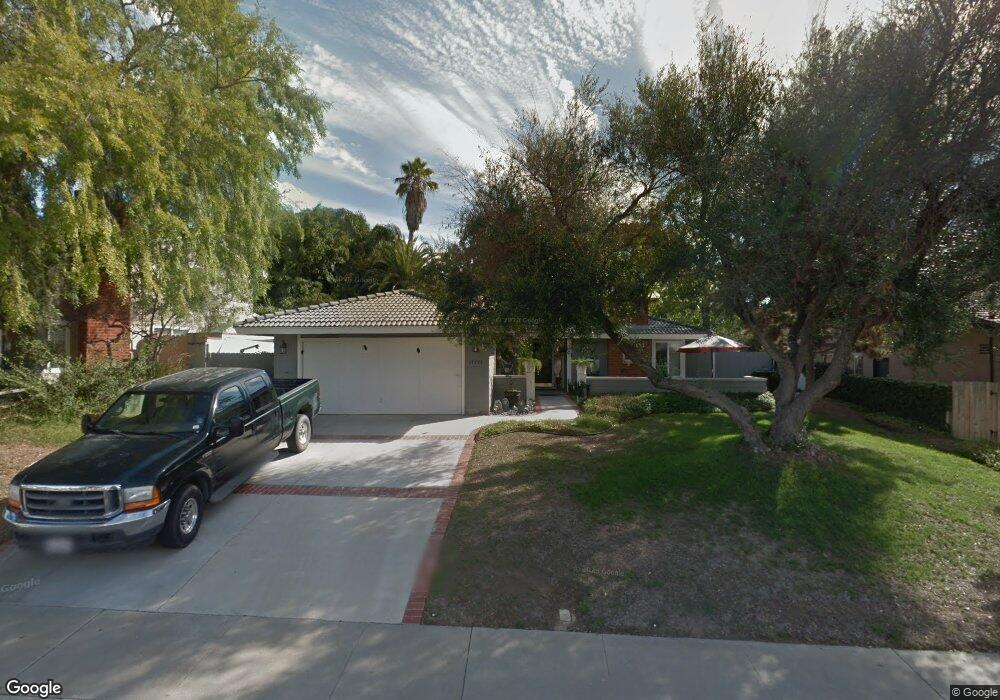
17795 Frondoso Dr San Diego, CA 92128
Rancho Bernardo NeighborhoodEstimated Value: $1,154,000 - $1,625,000
4
Beds
3
Baths
2,249
Sq Ft
$605/Sq Ft
Est. Value
About This Home
This home is located at 17795 Frondoso Dr, San Diego, CA 92128 and is currently estimated at $1,361,114, approximately $605 per square foot. 17795 Frondoso Dr is a home located in San Diego County with nearby schools including Chaparral Elementary, Bernardo Heights Middle, and Rancho Bernardo High.
Ownership History
Date
Name
Owned For
Owner Type
Purchase Details
Closed on
Jan 28, 2022
Sold by
Grenowich Kenneth P and Grenowich Debbra D
Bought by
Grenowich Family Trust
Current Estimated Value
Purchase Details
Closed on
Nov 6, 1997
Sold by
Johnson Philip E and Johnson Catherine N
Bought by
Grenowich Kenneth P and Grenowich Debbra D
Home Financials for this Owner
Home Financials are based on the most recent Mortgage that was taken out on this home.
Original Mortgage
$169,100
Interest Rate
7.23%
Purchase Details
Closed on
Dec 16, 1993
Sold by
Johnson Philip E
Bought by
Johnson Philip E and Johnson Catherine N
Home Financials for this Owner
Home Financials are based on the most recent Mortgage that was taken out on this home.
Original Mortgage
$67,000
Interest Rate
7.09%
Create a Home Valuation Report for This Property
The Home Valuation Report is an in-depth analysis detailing your home's value as well as a comparison with similar homes in the area
Home Values in the Area
Average Home Value in this Area
Purchase History
| Date | Buyer | Sale Price | Title Company |
|---|---|---|---|
| Grenowich Family Trust | -- | Law Office Of Scott C Soady | |
| Grenowich Kenneth P | $178,000 | Lawyers Title Insurance | |
| Johnson Philip E | -- | Gateway Title Company |
Source: Public Records
Mortgage History
| Date | Status | Borrower | Loan Amount |
|---|---|---|---|
| Previous Owner | Grenowich Kenneth P | $169,100 | |
| Previous Owner | Johnson Philip E | $67,000 |
Source: Public Records
Tax History Compared to Growth
Tax History
| Year | Tax Paid | Tax Assessment Tax Assessment Total Assessment is a certain percentage of the fair market value that is determined by local assessors to be the total taxable value of land and additions on the property. | Land | Improvement |
|---|---|---|---|---|
| 2025 | $4,410 | $401,624 | $114,311 | $287,313 |
| 2024 | $4,410 | $393,750 | $112,070 | $281,680 |
| 2023 | $4,315 | $386,030 | $109,873 | $276,157 |
| 2022 | $4,242 | $371,042 | $105,607 | $265,435 |
| 2021 | $4,185 | $371,042 | $105,607 | $265,435 |
| 2020 | $4,129 | $367,239 | $104,525 | $262,714 |
| 2019 | $4,021 | $360,039 | $102,476 | $257,563 |
| 2018 | $3,907 | $352,980 | $100,467 | $252,513 |
| 2017 | $3,801 | $346,060 | $98,498 | $247,562 |
| 2016 | $3,722 | $339,275 | $96,567 | $242,708 |
| 2015 | $3,666 | $334,180 | $95,117 | $239,063 |
| 2014 | $3,579 | $327,635 | $93,254 | $234,381 |
Source: Public Records
Map
Nearby Homes
- 12516 Camino Vuelo
- 17617 Pomerado Rd Unit 213
- 12580 Oaks North Dr Unit 12
- 12505 Oaks Dr N Unit 141
- 12575 Oaks Dr N Unit 220
- 12977 Camino Emparrado
- 12732 Camino de la Breccia Unit 9
- 12565 Oaks North Dr Unit 115
- 17676 Corte Sobrado
- 18304 Vezelay Ln
- 17762 Plaza Acosta
- 17738 Plaza Acosta
- 17842 Avenida Cordillera Unit 30
- 17473 Plaza Abierto Unit 30
- 17788 Caminito Balata
- 12880 Circulo Dardo
- 17461 Plaza Abierto Unit 22
- 14344 Savannah Ct
- 14342 Savannah Ct
- 12045 Sienna Ln
- 17807 Frondoso Dr
- 17781 Frondoso Dr
- 17821 Frondoso Dr
- 17769 Frondoso Dr
- 17788 Frondoso Dr
- 12452 Bodega Place
- 12515 Camino Vuelo
- 17835 Frondoso Dr
- 17751 Frondoso Dr
- 12523 Camino Vuelo
- 12444 Bodega Place
- 12505 Camino Vuelo
- 17816 Frondoso Dr
- 17806 Frondoso Dr
- 12533 Camino Vuelo
- 17836 Frondoso Dr
- 17826 Frondoso Dr
- 12436 Bodega Place
- 17849 Frondoso Dr
- 12541 Camino Vuelo