Estimated Value: $234,299 - $286,000
About This Home
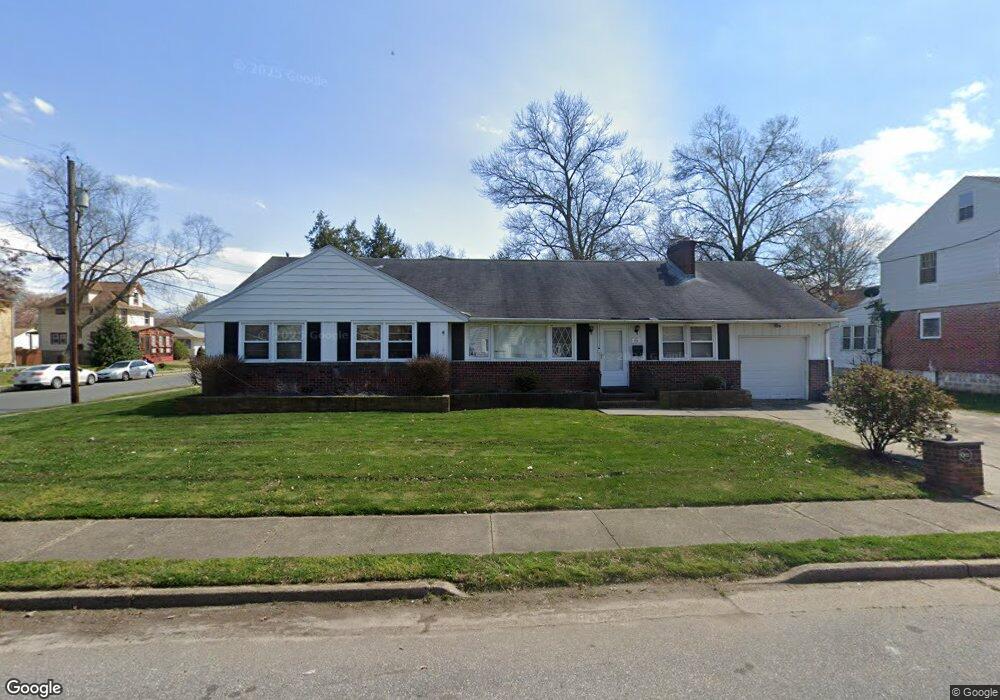
This home is located at 178 9th St, Salem, NJ 08079 and is currently estimated at $254,075, approximately $73 per square foot. 178 9th St is a home located in Salem County with nearby schools including John Fenwick Elementary School, Salem Middle School, and Salem High School.
Ownership History
We collect this data history from publicly available records. To have your information removed, we recommend requesting removal directly through your county’s website.
Purchase Details
Purchase Details
Home Financials for this Owner
Home Financials are based on the most recent Mortgage that was taken out on this home.Purchase Details
Home Values in the Area
Average Home Value in this Area
Purchase History
We collect this data history from publicly available records. To have your information removed, we recommend requesting removal directly through your county’s website.
| Date | Buyer | Sale Price | Title Company |
|---|---|---|---|
| -- | None Listed On Document | ||
| $117,000 | -- | ||
| $125,000 | West Jersey Title Agency |
Mortgage History
We collect this data history from publicly available records. To have your information removed, we recommend requesting removal directly through your county’s website.
| Date | Status | Borrower | Loan Amount |
|---|---|---|---|
| Previous Owner | $77,000 |
Tax History
We collect this data history from publicly available records. To have your information removed, we recommend requesting removal directly through your county’s website.
| Year | Tax Paid | Tax Assessment Tax Assessment Total Assessment is a certain percentage of the fair market value that is determined by local assessors to be the total taxable value of land and additions on the property. | Land | Improvement |
|---|---|---|---|---|
| 2025 | $7,441 | $90,500 | $17,300 | $73,200 |
| 2024 | $7,114 | $90,500 | $17,300 | $73,200 |
| 2023 | $7,114 | $90,500 | $17,300 | $73,200 |
| 2022 | $6,803 | $90,500 | $17,300 | $73,200 |
| 2021 | $5,943 | $90,500 | $17,300 | $73,200 |
| 2020 | $6,436 | $90,500 | $17,300 | $73,200 |
| 2019 | $6,397 | $90,500 | $17,300 | $73,200 |
| 2018 | $6,257 | $90,500 | $17,300 | $73,200 |
| 2017 | $6,181 | $90,500 | $17,300 | $73,200 |
| 2016 | $7,127 | $182,000 | $36,900 | $145,100 |
| 2015 | $9,394 | $243,000 | $36,900 | $206,100 |
| 2014 | $9,346 | $243,000 | $36,900 | $206,100 |
Map
- 262 Morrison Ave
- 33 Johnson St
- 159 Grant St
- 2 9th St
- 223 Johnson St
- 220 Johnson St
- 112 8th St
- 294 E Broadway
- 115 Eighth St
- 296 298 E Broadway E
- 155 Seventh St
- 324 Allen Ave
- 303 E Broadway
- 91 Eighth St
- 315 317 E Broadway
- 12 Church St
- 196 198 E Broadway
- 4 Walnut St
- 183 E Broadway Unit C-27
- 334 336 E Broadway
Ask me questions while you tour the home.