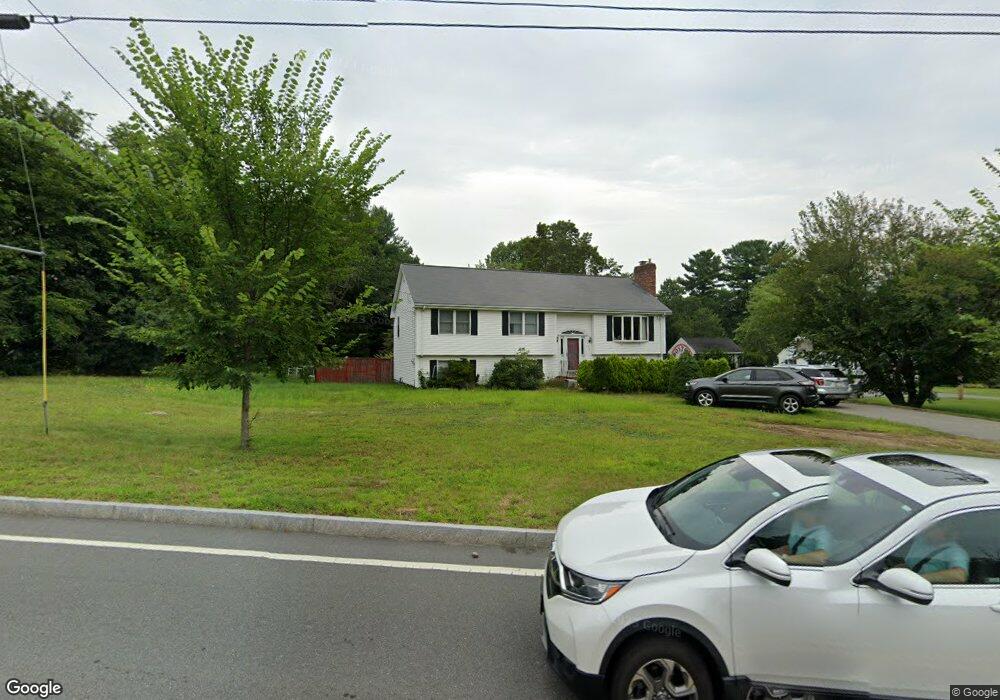
178 Allen Rd Billerica, MA 01821
Pinehurst NeighborhoodEstimated Value: $755,893 - $803,000
3
Beds
2
Baths
2,028
Sq Ft
$383/Sq Ft
Est. Value
About This Home
This home is located at 178 Allen Rd, Billerica, MA 01821 and is currently estimated at $776,223, approximately $382 per square foot. 178 Allen Rd is a home located in Middlesex County with nearby schools including Billerica Memorial High School.
Ownership History
Date
Name
Owned For
Owner Type
Purchase Details
Closed on
Nov 20, 2000
Sold by
Sorrentino Susan C and Sorrentino Roberto S
Bought by
Knight Mark R and Knight Rachael E
Current Estimated Value
Home Financials for this Owner
Home Financials are based on the most recent Mortgage that was taken out on this home.
Original Mortgage
$252,700
Outstanding Balance
$91,234
Interest Rate
7.78%
Mortgage Type
Purchase Money Mortgage
Estimated Equity
$684,989
Purchase Details
Closed on
Mar 20, 1998
Sold by
Mazzone Jeffrey J and Mazzone Janette M
Bought by
Sorrentino Roberto S and Sorrentino Susan C
Home Financials for this Owner
Home Financials are based on the most recent Mortgage that was taken out on this home.
Original Mortgage
$188,000
Interest Rate
6.92%
Mortgage Type
Purchase Money Mortgage
Create a Home Valuation Report for This Property
The Home Valuation Report is an in-depth analysis detailing your home's value as well as a comparison with similar homes in the area
Home Values in the Area
Average Home Value in this Area
Purchase History
| Date | Buyer | Sale Price | Title Company |
|---|---|---|---|
| Knight Mark R | $320,000 | -- | |
| Sorrentino Roberto S | $235,000 | -- |
Source: Public Records
Mortgage History
| Date | Status | Borrower | Loan Amount |
|---|---|---|---|
| Open | Sorrentino Roberto S | $252,700 | |
| Previous Owner | Sorrentino Roberto S | $188,000 | |
| Closed | Sorrentino Roberto S | $47,300 |
Source: Public Records
Tax History Compared to Growth
Tax History
| Year | Tax Paid | Tax Assessment Tax Assessment Total Assessment is a certain percentage of the fair market value that is determined by local assessors to be the total taxable value of land and additions on the property. | Land | Improvement |
|---|---|---|---|---|
| 2025 | $7,713 | $678,400 | $362,900 | $315,500 |
| 2024 | $6,951 | $615,700 | $328,300 | $287,400 |
| 2023 | $6,587 | $554,900 | $278,300 | $276,600 |
| 2022 | $6,268 | $495,900 | $256,100 | $239,800 |
| 2021 | $6,136 | $472,000 | $239,900 | $232,100 |
| 2020 | $6,009 | $462,600 | $230,500 | $232,100 |
| 2019 | $5,631 | $417,700 | $202,800 | $214,900 |
| 2018 | $5,499 | $387,500 | $187,800 | $199,700 |
| 2017 | $5,074 | $360,100 | $179,300 | $180,800 |
| 2016 | $5,062 | $358,000 | $177,200 | $180,800 |
| 2015 | $4,936 | $351,600 | $170,800 | $180,800 |
| 2014 | $4,936 | $345,400 | $160,500 | $184,900 |
Source: Public Records
Map
Nearby Homes
- 30 Wyman Rd
- 37 Porter St
- 64 Elizabeth Rd
- 11 Autumn St
- 88 Lexington Rd
- 86 Lexington Rd
- 19 Dustin Young Ln
- 11 Bicknell Rd
- 10 Greenville St
- 3 Cardington Ave
- 17 Ben Place
- 1 Albion Rd
- 5 Munroe Way
- 1 Purcell Dr
- 17 Glenvale Ave
- 8 Swan Ln
- 6 Glade St
- 22 Kenmar Dr Unit 194Y
- 14 Kenmar Dr Unit 111
- 30 Crimson Rd