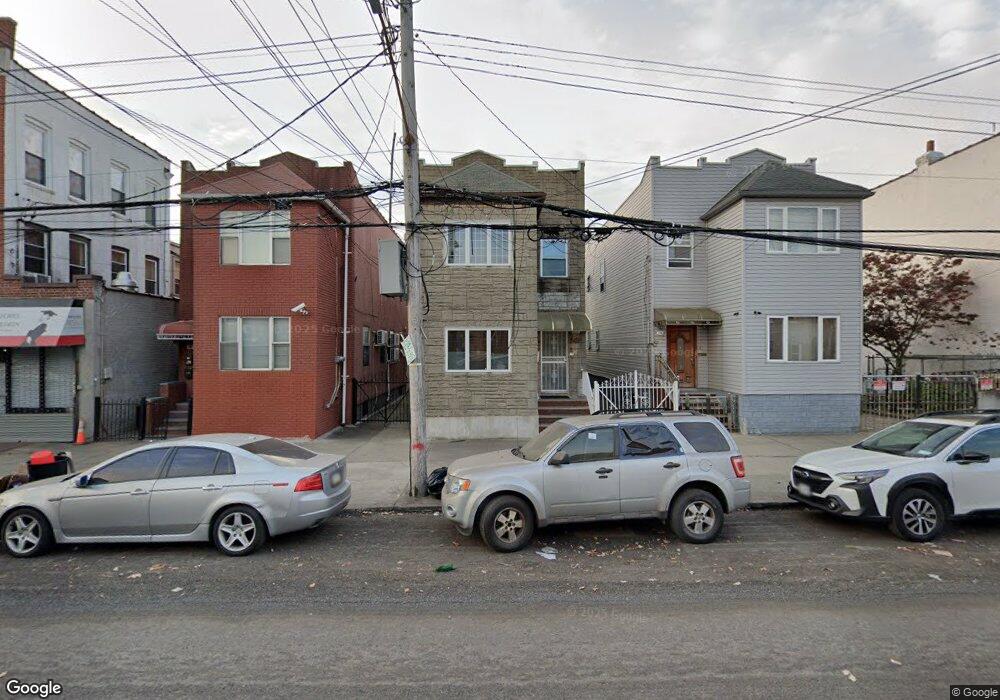
178 Avenue T Unit 1 Brooklyn, NY 11223
Gravesend NeighborhoodEstimated Value: $1,229,538 - $1,379,000
2
Beds
--
Bath
2,232
Sq Ft
$579/Sq Ft
Est. Value
About This Home
This home is located at 178 Avenue T Unit 1, Brooklyn, NY 11223 and is currently estimated at $1,291,885, approximately $578 per square foot. 178 Avenue T Unit 1 is a home located in Kings County with nearby schools including P.S. 95 - The Gravesend, Is 228 David A Boody, and Coney Island Preparatory Public Charter School.
Ownership History
Date
Name
Owned For
Owner Type
Purchase Details
Closed on
Feb 5, 2021
Sold by
Morello Frances and Morello Joseph
Bought by
Huang Dahuan and Lei Pei Ping
Current Estimated Value
Home Financials for this Owner
Home Financials are based on the most recent Mortgage that was taken out on this home.
Original Mortgage
$626,500
Outstanding Balance
$560,335
Interest Rate
2.7%
Mortgage Type
Purchase Money Mortgage
Estimated Equity
$731,550
Purchase Details
Closed on
Feb 18, 1997
Sold by
Dolatly Sadie
Bought by
Lanciers Richard and Cosares Christina
Create a Home Valuation Report for This Property
The Home Valuation Report is an in-depth analysis detailing your home's value as well as a comparison with similar homes in the area
Home Values in the Area
Average Home Value in this Area
Purchase History
| Date | Buyer | Sale Price | Title Company |
|---|---|---|---|
| Huang Dahuan | $990,000 | -- | |
| Lanciers Richard | -- | -- |
Source: Public Records
Mortgage History
| Date | Status | Borrower | Loan Amount |
|---|---|---|---|
| Open | Huang Dahuan | $626,500 |
Source: Public Records
Tax History Compared to Growth
Tax History
| Year | Tax Paid | Tax Assessment Tax Assessment Total Assessment is a certain percentage of the fair market value that is determined by local assessors to be the total taxable value of land and additions on the property. | Land | Improvement |
|---|---|---|---|---|
| 2025 | $8,556 | $75,840 | $13,860 | $61,980 |
| 2024 | $8,556 | $65,820 | $13,860 | $51,960 |
| 2023 | $8,409 | $78,120 | $13,860 | $64,260 |
| 2022 | $6,169 | $71,040 | $13,860 | $57,180 |
| 2021 | $8,394 | $70,200 | $13,860 | $56,340 |
| 2020 | $3,936 | $71,820 | $13,860 | $57,960 |
| 2019 | $7,426 | $61,380 | $13,860 | $47,520 |
| 2018 | $7,033 | $34,503 | $6,592 | $27,911 |
| 2017 | $7,000 | $34,338 | $7,739 | $26,599 |
| 2016 | $6,644 | $33,237 | $8,336 | $24,901 |
| 2015 | $3,907 | $31,356 | $10,331 | $21,025 |
| 2014 | $3,907 | $29,582 | $9,835 | $19,747 |
Source: Public Records
Map
Nearby Homes