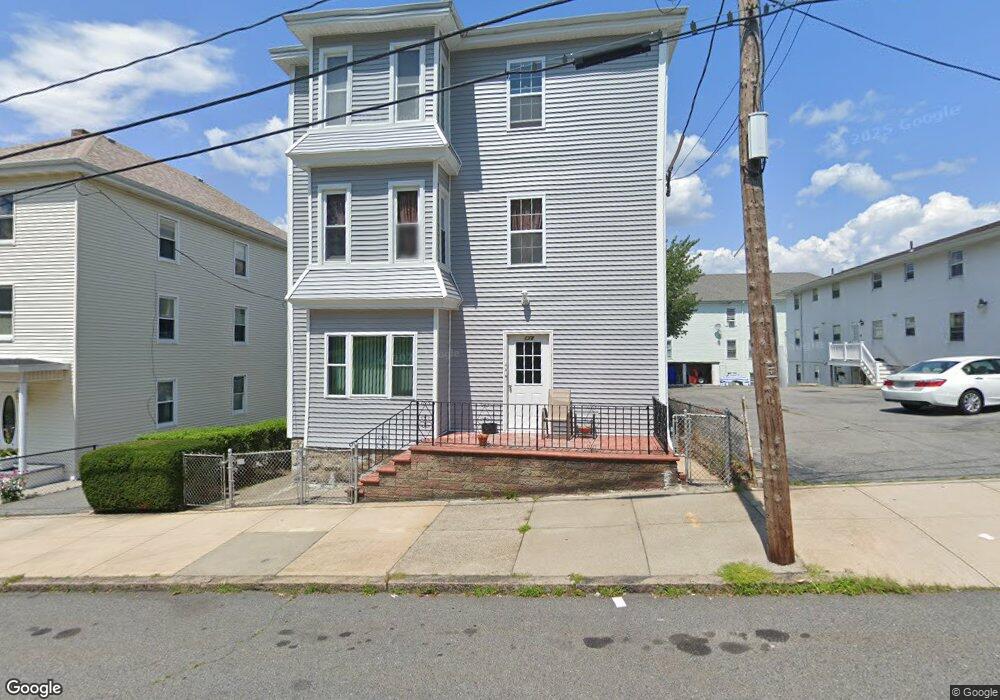
178 Bradford Ave Fall River, MA 02721
Sandy Beach NeighborhoodEstimated Value: $626,000 - $690,000
9
Beds
3
Baths
3,945
Sq Ft
$165/Sq Ft
Est. Value
About This Home
This home is located at 178 Bradford Ave, Fall River, MA 02721 and is currently estimated at $649,667, approximately $164 per square foot. 178 Bradford Ave is a home located in Bristol County with nearby schools including John J. Doran Community School, Matthew J. Kuss Middle School, and B M C Durfee High School.
Ownership History
Date
Name
Owned For
Owner Type
Purchase Details
Closed on
Jul 12, 2023
Sold by
Quintal Daniel and Quintal Daniel
Bought by
Quintal Daniel and Quintal Daniel
Current Estimated Value
Purchase Details
Closed on
Oct 18, 2021
Sold by
Quintal Investments Llc
Bought by
Quintal Daniel
Purchase Details
Closed on
Jun 17, 2020
Sold by
Moniz Joyce A
Bought by
Moniz-Bisson Joyce A and Bisson Robert
Purchase Details
Closed on
May 17, 2007
Sold by
Moniz Joyce Ann
Bought by
Moniz Joyce Ann
Create a Home Valuation Report for This Property
The Home Valuation Report is an in-depth analysis detailing your home's value as well as a comparison with similar homes in the area
Home Values in the Area
Average Home Value in this Area
Purchase History
| Date | Buyer | Sale Price | Title Company |
|---|---|---|---|
| Quintal Daniel | -- | None Available | |
| Quintal Daniel | -- | None Available | |
| Moniz-Bisson Joyce A | -- | None Available | |
| Moniz Joyce Ann | -- | -- |
Source: Public Records
Tax History
| Year | Tax Paid | Tax Assessment Tax Assessment Total Assessment is a certain percentage of the fair market value that is determined by local assessors to be the total taxable value of land and additions on the property. | Land | Improvement |
|---|---|---|---|---|
| 2025 | $5,678 | $495,900 | $108,700 | $387,200 |
| 2024 | $5,438 | $473,300 | $104,700 | $368,600 |
| 2023 | $4,831 | $393,700 | $86,500 | $307,200 |
| 2022 | $3,978 | $341,700 | $82,400 | $259,300 |
| 2021 | $3,978 | $287,600 | $78,400 | $209,200 |
| 2020 | $3,595 | $248,800 | $77,200 | $171,600 |
| 2019 | $3,098 | $212,500 | $74,400 | $138,100 |
| 2018 | $3,094 | $211,600 | $80,500 | $131,100 |
| 2017 | $2,911 | $207,900 | $76,800 | $131,100 |
| 2016 | $2,858 | $209,700 | $81,700 | $128,000 |
| 2015 | $2,743 | $209,700 | $81,700 | $128,000 |
| 2014 | $2,753 | $218,800 | $79,300 | $139,500 |
Source: Public Records
Map
Nearby Homes
- 700 Shore Dr Unit 6-604
- 700 Shore Dr Unit 1205
- 700 Shore Dr Unit 810
- 303 Eagle St Unit C
- 420 Bradford Ave
- 403 Division St Unit 13
- 403 Division St Unit 5
- 403 Division St Unit 9
- 403 Division St Unit 11
- 403 Division St Unit 12
- 403 Division St Unit 1
- 403 Division St Unit 18
- 70 Brown St
- 315 William St
- 327 William St
- 330 William St
- 334 Fountain St
- 271 Mulberry St
- 169 Grant St
- 165 Grant St
- 178 Bradford Ave Unit 2
- 166 Bradford Ave Unit 3
- 333 Almond St Unit 6
- 333 Almond St
- 156 Bradford Ave
- 100 Howard St Unit 1
- 100 Howard St Unit 6
- 100 Howard St Unit 7
- 116 Howard St Unit 4
- 116 Howard St
- 210 Bradford Ave
- 293 Almond St
- 310 Almond St
- 220 Bradford Ave
- 132 Bradford Ave
- 300 Almond St
- 117 Howard St
- 117 Howard St Unit 1
- 119 Division St
- 129 Division St
Your Personal Tour Guide
Ask me questions while you tour the home.