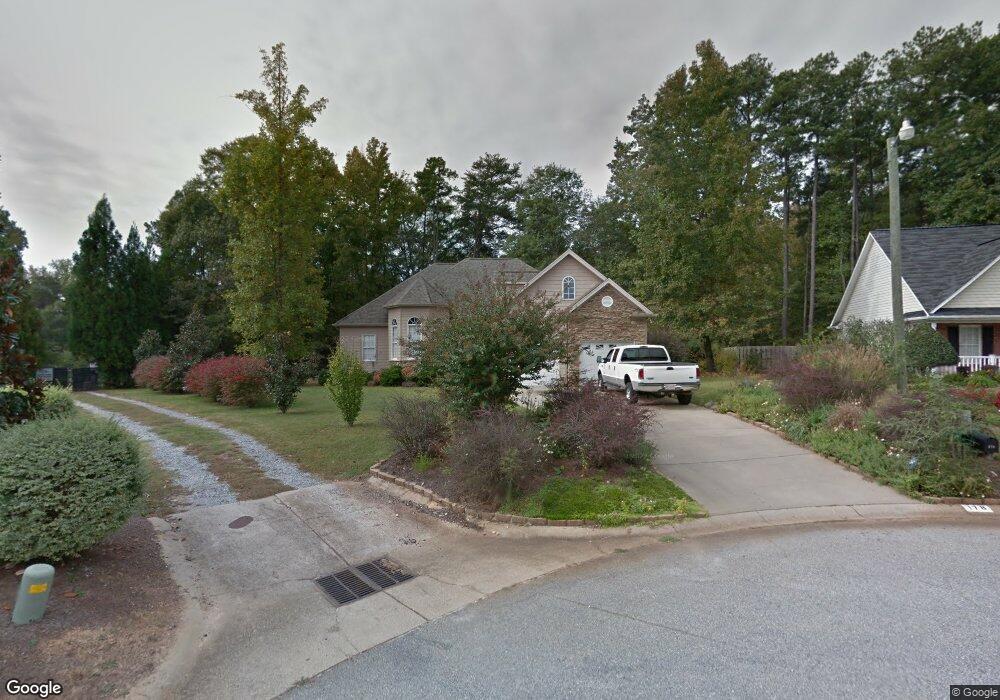
178 Bradford Crossing Dr Roebuck, SC 29376
Estimated Value: $307,724 - $332,000
3
Beds
2
Baths
2,181
Sq Ft
$146/Sq Ft
Est. Value
About This Home
This home is located at 178 Bradford Crossing Dr, Roebuck, SC 29376 and is currently estimated at $318,181, approximately $145 per square foot. 178 Bradford Crossing Dr is a home located in Spartanburg County with nearby schools including Dorman High School Freshman Campus, Dorman High School, and Eddlemon Adventist School.
Ownership History
Date
Name
Owned For
Owner Type
Purchase Details
Closed on
Jul 14, 2016
Sold by
Travis L Oates Llc
Bought by
Mace Obby S
Current Estimated Value
Home Financials for this Owner
Home Financials are based on the most recent Mortgage that was taken out on this home.
Original Mortgage
$169,170
Outstanding Balance
$134,874
Interest Rate
3.54%
Mortgage Type
VA
Estimated Equity
$183,307
Purchase Details
Closed on
Aug 17, 2010
Sold by
Tm Equity Corporation
Bought by
Travis L Oates Llc
Purchase Details
Closed on
Nov 19, 2009
Sold by
Mace Bobby S and Mace Cynthia M
Bought by
Tm Equity Corporation
Purchase Details
Closed on
Jun 5, 2007
Sold by
Drum David L and Drum Carol A
Bought by
Mace Bobby S and Mace Cynthia M
Home Financials for this Owner
Home Financials are based on the most recent Mortgage that was taken out on this home.
Original Mortgage
$219,622
Interest Rate
6.1%
Mortgage Type
VA
Purchase Details
Closed on
Jun 26, 2003
Sold by
Vision Builders Of The Upstate Llc
Bought by
Drum David L and Drum Carol A
Purchase Details
Closed on
Feb 26, 2002
Sold by
Salem Associates Inc
Bought by
Vision Builders Of The Upstate Llc
Create a Home Valuation Report for This Property
The Home Valuation Report is an in-depth analysis detailing your home's value as well as a comparison with similar homes in the area
Home Values in the Area
Average Home Value in this Area
Purchase History
| Date | Buyer | Sale Price | Title Company |
|---|---|---|---|
| Mace Obby S | $165,000 | None Available | |
| Travis L Oates Llc | $191,722 | -- | |
| Tm Equity Corporation | $192,000 | -- | |
| Mace Bobby S | $215,000 | None Available | |
| Drum David L | $195,000 | -- | |
| Vision Builders Of The Upstate Llc | $21,000 | -- |
Source: Public Records
Mortgage History
| Date | Status | Borrower | Loan Amount |
|---|---|---|---|
| Open | Mace Obby S | $169,170 | |
| Previous Owner | Mace Bobby S | $219,622 |
Source: Public Records
Tax History Compared to Growth
Tax History
| Year | Tax Paid | Tax Assessment Tax Assessment Total Assessment is a certain percentage of the fair market value that is determined by local assessors to be the total taxable value of land and additions on the property. | Land | Improvement |
|---|---|---|---|---|
| 2025 | $1,310 | $8,850 | $1,043 | $7,807 |
| 2024 | $1,310 | $8,850 | $1,043 | $7,807 |
| 2023 | $1,310 | $8,850 | $1,043 | $7,807 |
| 2022 | $1,131 | $7,695 | $996 | $6,699 |
| 2021 | $1,488 | $7,695 | $996 | $6,699 |
| 2020 | $1,454 | $7,695 | $996 | $6,699 |
| 2019 | $1,415 | $7,695 | $996 | $6,699 |
| 2018 | $1,421 | $7,695 | $996 | $6,699 |
| 2017 | $1,225 | $6,692 | $1,000 | $5,692 |
| 2016 | $1,341 | $7,184 | $1,000 | $6,184 |
| 2015 | $3,974 | $10,776 | $1,500 | $9,276 |
| 2014 | $3,883 | $10,776 | $1,500 | $9,276 |
Source: Public Records
Map
Nearby Homes
- 313 New Windsor Ct
- 2013 Hillman Way
- 2011 Hillman Way
- Ashford Plan at Trenton Place
- 2009 Hillman Way
- 506 Rose Trellis Ct
- 436 Rambling Rose Way
- 919 Equine Dr
- 524 Semillon Ln
- 58 Arbours Ln W
- 6003 Haddington Dr
- Edinburg Plan at Highland Park
- Cypress Plan at Highland Park
- Arlington Plan at Highland Park
- 140 Eastbrook Terrace
- 229 Georgetown Ct
- 260 Eastbrook Terrace
- 427 Listrac Dr
- 442 Listrac Dr
- 174 Bradford Crossing Dr
- 177 Bradford Crossing Dr
- 370 Herndon Terrace
- 170 Bradford Crossing Dr
- 173 Bradford Crossing Dr
- 166 166 Bradford Crossing Dr
- 166 Bradford Crossing Dr
- 167 Bradford Crossing Dr
- 706 Herndon Terrace
- 163 Bradford Crossing Dr
- 162 Bradford Crossing Dr
- 710 Herndon Terrace
- 834 Bluffton Dr
- 830 Bluffton Dr
- 159 Bradford Crossing Dr
- 158 Bradford Crossing Dr
- 714 Herndon Terrace
- 826 Bluffton Dr
- 155 Bradford Crossing Dr
- 129 Littlejohn Ct