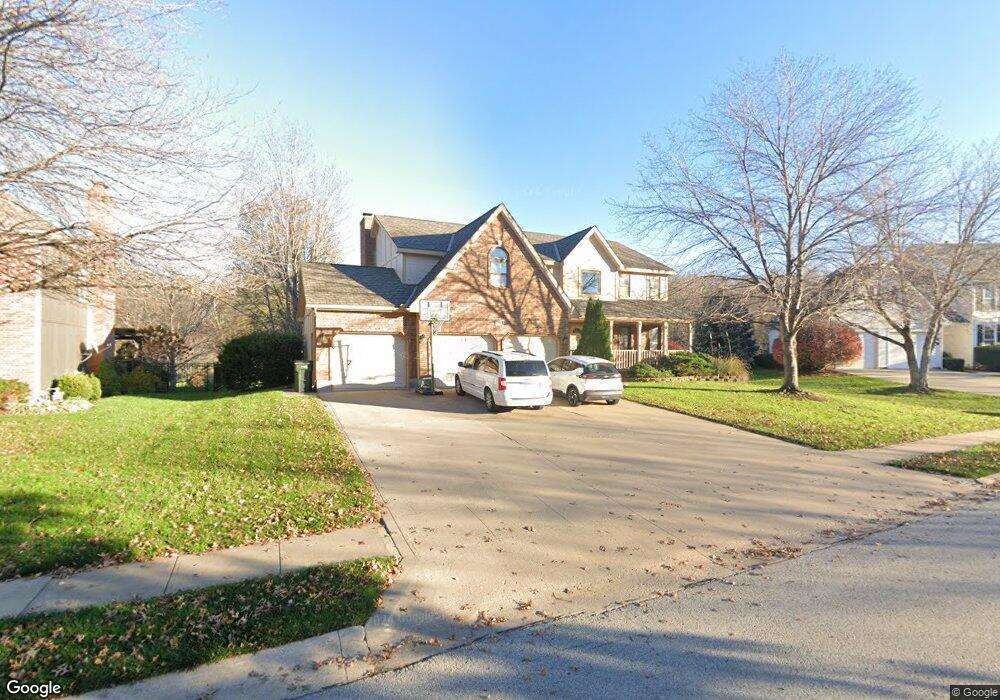
178 Canyon View Dr Lansing, KS 66043
Estimated Value: $429,000 - $482,000
4
Beds
4
Baths
2,835
Sq Ft
$159/Sq Ft
Est. Value
About This Home
This home is located at 178 Canyon View Dr, Lansing, KS 66043 and is currently estimated at $451,523, approximately $159 per square foot. 178 Canyon View Dr is a home located in Leavenworth County with nearby schools including Lansing Elementary School, Lansing Middle 6-8, and Lansing High 9-12.
Ownership History
Date
Name
Owned For
Owner Type
Purchase Details
Closed on
Jul 1, 1998
Bought by
Kidder Bruce L and Kidder Brigitte R
Current Estimated Value
Home Financials for this Owner
Home Financials are based on the most recent Mortgage that was taken out on this home.
Original Mortgage
$168,000
Outstanding Balance
$22,197
Interest Rate
6.96%
Mortgage Type
New Conventional
Estimated Equity
$429,326
Create a Home Valuation Report for This Property
The Home Valuation Report is an in-depth analysis detailing your home's value as well as a comparison with similar homes in the area
Home Values in the Area
Average Home Value in this Area
Purchase History
| Date | Buyer | Sale Price | Title Company |
|---|---|---|---|
| Kidder Bruce L | $204,000 | -- |
Source: Public Records
Mortgage History
| Date | Status | Borrower | Loan Amount |
|---|---|---|---|
| Open | Kidder Bruce L | $168,000 | |
| Closed | Kidder Bruce L | $141,500 |
Source: Public Records
Tax History
| Year | Tax Paid | Tax Assessment Tax Assessment Total Assessment is a certain percentage of the fair market value that is determined by local assessors to be the total taxable value of land and additions on the property. | Land | Improvement |
|---|---|---|---|---|
| 2025 | $6,440 | $49,419 | $5,261 | $44,158 |
| 2024 | $6,104 | $47,518 | $5,261 | $42,257 |
| 2023 | $6,104 | $46,779 | $5,261 | $41,518 |
| 2022 | $5,869 | $42,527 | $4,419 | $38,108 |
| 2021 | $5,766 | $39,939 | $4,419 | $35,520 |
| 2020 | $5,412 | $36,903 | $4,419 | $32,484 |
| 2019 | $5,346 | $36,409 | $4,419 | $31,990 |
| 2018 | $5,163 | $35,191 | $4,419 | $30,772 |
| 2017 | $5,023 | $34,166 | $4,419 | $29,747 |
| 2016 | $5,026 | $34,166 | $4,419 | $29,747 |
| 2015 | $4,988 | $34,010 | $4,419 | $29,591 |
| 2014 | $4,886 | $34,010 | $4,419 | $29,591 |
Source: Public Records
Map
Nearby Homes
- 189 Canyon View Dr
- 111 Southfork Rd
- 875 Clearview Dr
- 1322 Rock Creek Ct
- 898 Clearview Dr
- 24431 139th St
- 1221 S Desoto Rd
- 13965 Mc Intyre Rd
- 922 Southfork St
- 13788 McIntyre1 Rd
- 13788 Mcintyre Rd
- 13788 McIntyre2 Rd
- 811 4-H Rd
- 26731 147th St
- 202 S Main St
- 124 S Main St
- 218 E Kay St
- 130 Hampton Ct
- 20958 Ida St
- 15683 Gilman Rd
- 180 Canyon View Dr
- 176 Canyon View Dr
- 182 Canyon View Dr
- 185 Canyon View Dr
- 187 Canyon View Dr
- 174 Canyon View Dr
- 184 Canyon View Dr
- 183 Canyon View Dr
- 191 Canyon View Dr
- 186 Canyon View Dr
- 211 Southfork Rd
- 181 Canyon View Dr
- 170 Canyon View Dr
- 209 Southfork Rd
- 188 Canyon View Dr
- 207 Southfork Rd
- 168 Canyon View Dr
- 195 Canyon View Dr
- 205 Southfork Rd
- 210 Southfork Rd
Your Personal Tour Guide
Ask me questions while you tour the home.