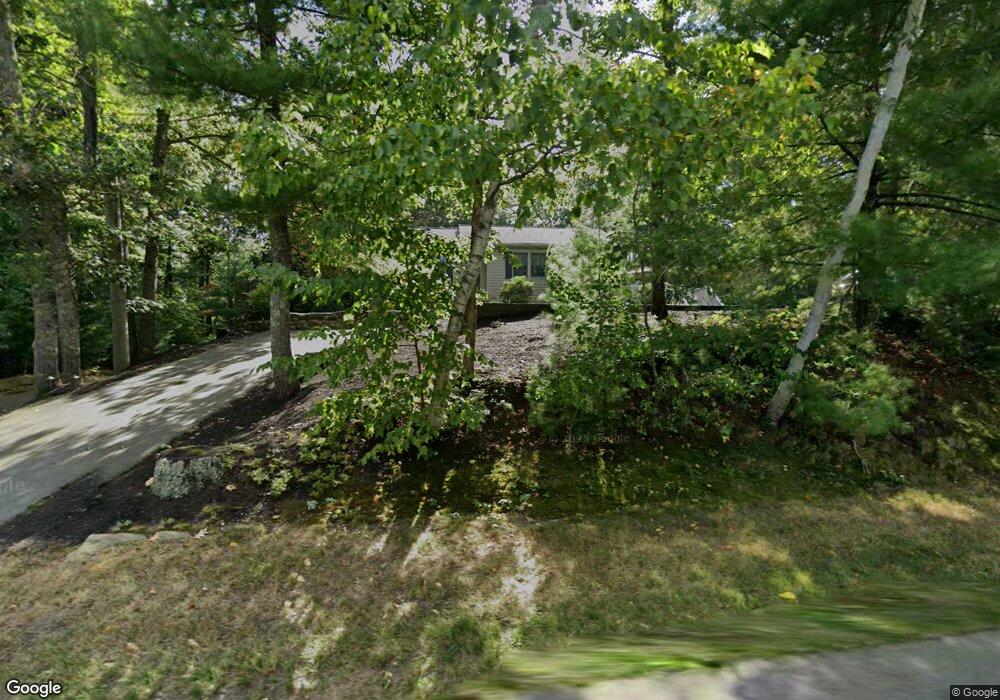
178 Center St Carver, MA 02330
Estimated Value: $530,000 - $584,000
3
Beds
1
Bath
1,084
Sq Ft
$512/Sq Ft
Est. Value
About This Home
This home is located at 178 Center St, Carver, MA 02330 and is currently estimated at $555,126, approximately $512 per square foot. 178 Center St is a home located in Plymouth County with nearby schools including Carver Elementary School and Carver Middle/High School.
Ownership History
Date
Name
Owned For
Owner Type
Purchase Details
Closed on
Nov 30, 1998
Sold by
Cordeiro Wayne J and Cordeiro Deborah J
Bought by
Burr Peter J
Current Estimated Value
Home Financials for this Owner
Home Financials are based on the most recent Mortgage that was taken out on this home.
Original Mortgage
$127,920
Interest Rate
6.83%
Mortgage Type
Purchase Money Mortgage
Purchase Details
Closed on
Nov 19, 1993
Sold by
Fhlmc
Bought by
Cordeiro Wayne J
Purchase Details
Closed on
Apr 19, 1989
Sold by
Dunlop James P
Bought by
Olson Robert D
Create a Home Valuation Report for This Property
The Home Valuation Report is an in-depth analysis detailing your home's value as well as a comparison with similar homes in the area
Home Values in the Area
Average Home Value in this Area
Purchase History
| Date | Buyer | Sale Price | Title Company |
|---|---|---|---|
| Burr Peter J | $159,900 | -- | |
| Cordeiro Wayne J | $97,000 | -- | |
| Olson Robert D | $128,000 | -- |
Source: Public Records
Mortgage History
| Date | Status | Borrower | Loan Amount |
|---|---|---|---|
| Open | Olson Robert D | $187,000 | |
| Closed | Olson Robert D | $162,000 | |
| Closed | Olson Robert D | $127,920 |
Source: Public Records
Tax History
| Year | Tax Paid | Tax Assessment Tax Assessment Total Assessment is a certain percentage of the fair market value that is determined by local assessors to be the total taxable value of land and additions on the property. | Land | Improvement |
|---|---|---|---|---|
| 2025 | $6,805 | $490,600 | $140,100 | $350,500 |
| 2024 | $6,443 | $454,700 | $137,400 | $317,300 |
| 2023 | $6,271 | $429,800 | $137,400 | $292,400 |
| 2022 | $6,037 | $377,800 | $123,900 | $253,900 |
| 2021 | $5,665 | $334,400 | $110,700 | $223,700 |
| 2020 | $5,401 | $314,200 | $103,400 | $210,800 |
| 2019 | $5,255 | $308,200 | $100,400 | $207,800 |
| 2018 | $4,928 | $279,500 | $100,400 | $179,100 |
| 2017 | $4,764 | $269,300 | $96,600 | $172,700 |
| 2016 | $4,307 | $252,900 | $87,200 | $165,700 |
| 2015 | $4,106 | $241,400 | $87,200 | $154,200 |
| 2014 | $4,006 | $235,500 | $104,100 | $131,400 |
Source: Public Records
Map
Nearby Homes
Your Personal Tour Guide
Ask me questions while you tour the home.