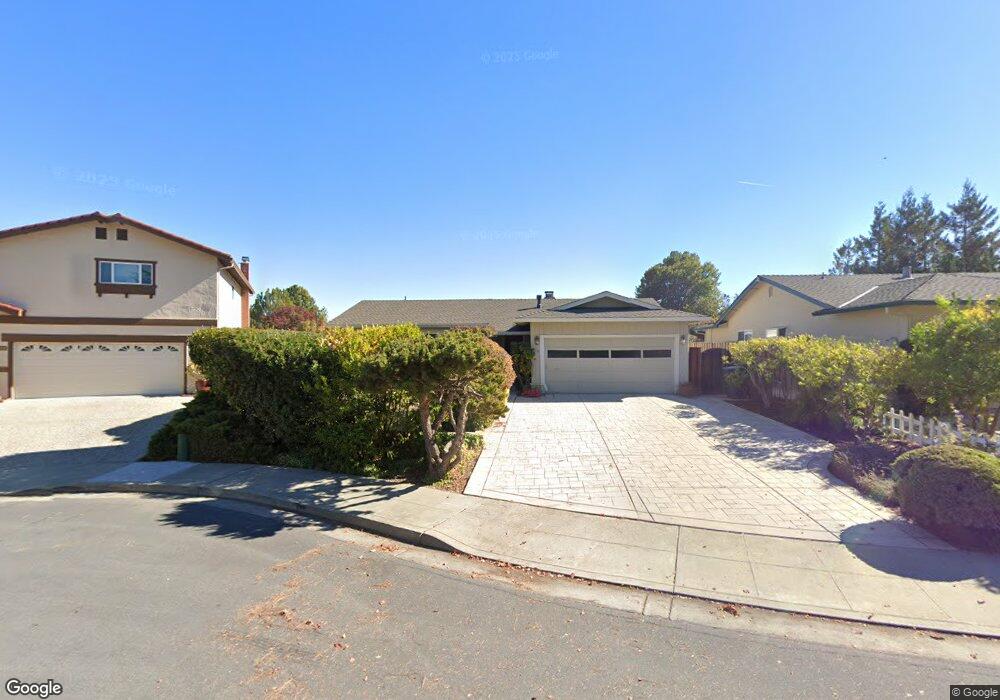
178 Corral Ave Sunnyvale, CA 94086
Estimated Value: $2,517,000 - $2,701,060
3
Beds
2
Baths
1,681
Sq Ft
$1,572/Sq Ft
Est. Value
About This Home
This home is located at 178 Corral Ave, Sunnyvale, CA 94086 and is currently estimated at $2,643,265, approximately $1,572 per square foot. 178 Corral Ave is a home located in Santa Clara County with nearby schools including Vargas Elementary School, Sunnyvale Middle School, and Homestead High School.
Ownership History
Date
Name
Owned For
Owner Type
Purchase Details
Closed on
Apr 29, 2022
Sold by
Sylvia Wirnowski Trust and Wirnowski Sylvia
Bought by
John P Wirnowski 2020 Trust and Wirnowski
Current Estimated Value
Purchase Details
Closed on
Jul 23, 2020
Sold by
Wirnowski John P
Bought by
Wirnowski John P and The John P Wirnowski 2020 Trus
Purchase Details
Closed on
Jul 17, 2015
Sold by
Wirnowski Sylvia
Bought by
Wirnowski Sylvia and Sylvia Wirnowski Trust
Purchase Details
Closed on
Mar 10, 1998
Sold by
Gomez Larry J and Stinson Katalin E
Bought by
Wirnowksi John P and Wirnowski Sylvia
Home Financials for this Owner
Home Financials are based on the most recent Mortgage that was taken out on this home.
Original Mortgage
$227,000
Interest Rate
7%
Purchase Details
Closed on
Mar 14, 1994
Sold by
Gomez Larry J and Stinson Katalin E
Bought by
Gomez Larry J and Stinson Katalin E
Home Financials for this Owner
Home Financials are based on the most recent Mortgage that was taken out on this home.
Original Mortgage
$70,000
Interest Rate
7%
Create a Home Valuation Report for This Property
The Home Valuation Report is an in-depth analysis detailing your home's value as well as a comparison with similar homes in the area
Purchase History
| Date | Buyer | Sale Price | Title Company |
|---|---|---|---|
| John P Wirnowski 2020 Trust | -- | None Listed On Document | |
| Wirnowski John P | -- | None Available | |
| Wirnowski Sylvia | -- | None Available | |
| Wirnowksi John P | -- | Old Republic Title Company | |
| Gomez Larry J | -- | Gateway Title Company |
Source: Public Records
Mortgage History
| Date | Status | Borrower | Loan Amount |
|---|---|---|---|
| Previous Owner | Wirnowksi John P | $227,000 | |
| Previous Owner | Gomez Larry J | $70,000 | |
| Closed | Gomez Larry J | $25,000 |
Source: Public Records
Tax History
| Year | Tax Paid | Tax Assessment Tax Assessment Total Assessment is a certain percentage of the fair market value that is determined by local assessors to be the total taxable value of land and additions on the property. | Land | Improvement |
|---|---|---|---|---|
| 2025 | $7,166 | $622,717 | $479,020 | $143,697 |
| 2024 | $7,166 | $610,508 | $469,628 | $140,880 |
| 2023 | $7,098 | $598,538 | $460,420 | $138,118 |
| 2022 | $6,988 | $586,803 | $451,393 | $135,410 |
| 2021 | $6,920 | $575,298 | $442,543 | $132,755 |
| 2020 | $6,913 | $569,400 | $438,006 | $131,394 |
| 2019 | $6,761 | $558,236 | $429,418 | $128,818 |
| 2018 | $6,627 | $547,292 | $420,999 | $126,293 |
| 2017 | $6,542 | $536,562 | $412,745 | $123,817 |
| 2016 | $6,285 | $526,042 | $404,652 | $121,390 |
| 2015 | $6,321 | $518,141 | $398,574 | $119,567 |
| 2014 | -- | $507,992 | $390,767 | $117,225 |
Source: Public Records
Map
Nearby Homes
- 1155 W Mc Kinley Ave
- 1237 Coronado Dr
- 1241 Coronado Dr
- 1248 Cortez Dr
- 1096 W Mckinley Ave
- 1035 Fuller Terrace
- 136 S Mary Ave
- 377 S Mary Ave
- 433 Sylvan Ave Unit 120
- 433 Sylvan Ave
- 433 Sylvan Ave Unit 84
- 433 Sylvan Ave Unit 134
- 325 Sylvan Ave Unit 23
- 325 Sylvan Ave
- 992 Alpine Terrace Unit 5
- 992 Alpine Terrace Unit 6
- 621 Charmain Cir
- 187 Sunset Ave
- 972 Belmont Terrace Unit 7
- 975 Belmont Terrace Unit 2
- 182 Corral Ave
- 174 Corral Ave
- 186 Corral Ave
- 1159 Corral Ave
- 1164 Corral Ave
- 1163 Corral Ave
- 190 Corral Ave
- 1158 Crespi Dr
- 1154 Crespi Dr
- 1153 W Washington Ave
- 1168 Corral Ave
- 1162 Crespi Dr
- 1167 Corral Ave
- 187 Corral Ave
- 1150 Crespi Dr
- 1166 Crespi Dr
- 194 Corral Ave
- 1146 Crespi Dr
- 1171 Corral Ave
- 1172 Corral Ave
Your Personal Tour Guide
Ask me questions while you tour the home.