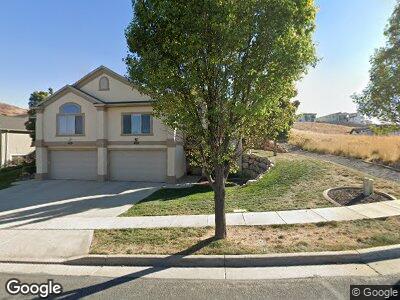
178 E Edgecrest Ln North Salt Lake, UT 84054
Estimated Value: $657,000 - $698,624
5
Beds
3
Baths
3,451
Sq Ft
$196/Sq Ft
Est. Value
About This Home
This home is located at 178 E Edgecrest Ln, North Salt Lake, UT 84054 and is currently estimated at $676,656, approximately $196 per square foot. 178 E Edgecrest Ln is a home located in Davis County with nearby schools including Orchard School, South Davis Junior High School, and Woods Cross High School.
Ownership History
Date
Name
Owned For
Owner Type
Purchase Details
Closed on
May 11, 2021
Sold by
Edgecrest Investments Llc
Bought by
Eastin Joseph
Current Estimated Value
Purchase Details
Closed on
May 10, 2021
Sold by
Eastin Joseph
Bought by
Eastin Joseph and Evans Debra
Purchase Details
Closed on
Aug 19, 2019
Sold by
Waite Eric and Waite Valerie
Bought by
Edgecrest Investments Llc
Purchase Details
Closed on
Jan 29, 2015
Sold by
Stepan Christopher J
Bought by
Waite Eric and Waite Valerie
Purchase Details
Closed on
Dec 26, 2006
Sold by
Edgewood Nsl Development Inc
Bought by
Stepan Christopher J and Stepan Camille N
Home Financials for this Owner
Home Financials are based on the most recent Mortgage that was taken out on this home.
Original Mortgage
$155,000
Interest Rate
6.22%
Mortgage Type
Purchase Money Mortgage
Create a Home Valuation Report for This Property
The Home Valuation Report is an in-depth analysis detailing your home's value as well as a comparison with similar homes in the area
Home Values in the Area
Average Home Value in this Area
Purchase History
| Date | Buyer | Sale Price | Title Company |
|---|---|---|---|
| Eastin Joseph | -- | Backman Title Servic | |
| Eastin Joseph | -- | Metro Natl Title Ass | |
| Edgecrest Investments Llc | -- | None Available | |
| Waite Eric | -- | Backman Title Servi | |
| Stepan Christopher J | -- | First American Title |
Source: Public Records
Mortgage History
| Date | Status | Borrower | Loan Amount |
|---|---|---|---|
| Previous Owner | Stepan Christopher J | $250,000 | |
| Previous Owner | Stepan Christopher J | $155,000 | |
| Previous Owner | Edgewood Nsl Development Inc | $1,800,000 |
Source: Public Records
Tax History Compared to Growth
Tax History
| Year | Tax Paid | Tax Assessment Tax Assessment Total Assessment is a certain percentage of the fair market value that is determined by local assessors to be the total taxable value of land and additions on the property. | Land | Improvement |
|---|---|---|---|---|
| 2024 | $3,270 | $328,900 | $83,050 | $245,850 |
| 2023 | $3,321 | $604,000 | $170,000 | $434,000 |
| 2022 | $3,460 | $345,400 | $44,550 | $300,850 |
| 2021 | $2,937 | $445,000 | $101,500 | $343,500 |
| 2020 | $2,516 | $377,000 | $93,200 | $283,800 |
| 2019 | $2,956 | $432,000 | $82,000 | $350,000 |
| 2018 | $2,781 | $402,000 | $83,000 | $319,000 |
| 2016 | $2,563 | $197,010 | $29,150 | $167,860 |
| 2015 | $2,649 | $195,635 | $29,150 | $166,485 |
| 2014 | $2,900 | $218,312 | $29,150 | $189,162 |
| 2013 | -- | $209,285 | $32,065 | $177,220 |
Source: Public Records
Map
Nearby Homes
- 712 S Miller Ave
- 242 E Ridgeline Way
- 755 Parkway Dr
- 804 S Finley Cir Unit 243
- 238 E Hillcrest Way
- 673 Parkway Dr
- 850 S Finley Cir Unit 239
- 871 S Winter Ln
- 889 S Winter Ln
- 946 S Winter Ln Unit 213
- 928 S Pace Place
- 398 Lofty Ln
- 843 Eaglepointe Dr
- 134 E 175 S
- 990 Plum Tree Ct Unit 9
- 51 E Vantage Dr
- 1010 Plum Tree Ct Unit 8
- 985 Plum Tree Ct Unit 1
- 96 S 350 E
- 94 S Walker Ln
- 178 E Edgecrest Ln
- 178 Edgecrest Ln
- 180 Edgecrest Ln
- 180 E Edgecrest Ln
- 192 E Edgecrest Ln
- 192 Edgecrest Ln
- 194 Edgecrest Ln
- 194 Edgecrest Ln Unit 51-A
- 171 E Edgecrest Ln
- 177 E Edgecrest Ln Unit 18
- 185 E Edgecrest Ln Unit 17
- 206 E Edgecrest Ln
- 206 Edgecrest Ln
- 206 Edgecrest Ln Unit 50-B
- 209 Edgewood Cir
- 209 Edgewood Cir Unit 48 A
- 191 E Edgecrest Ln Unit 16
- 163 E Edgecrest Ln
- 659 S Burkhill Ln
- 667 Burkhill Ln