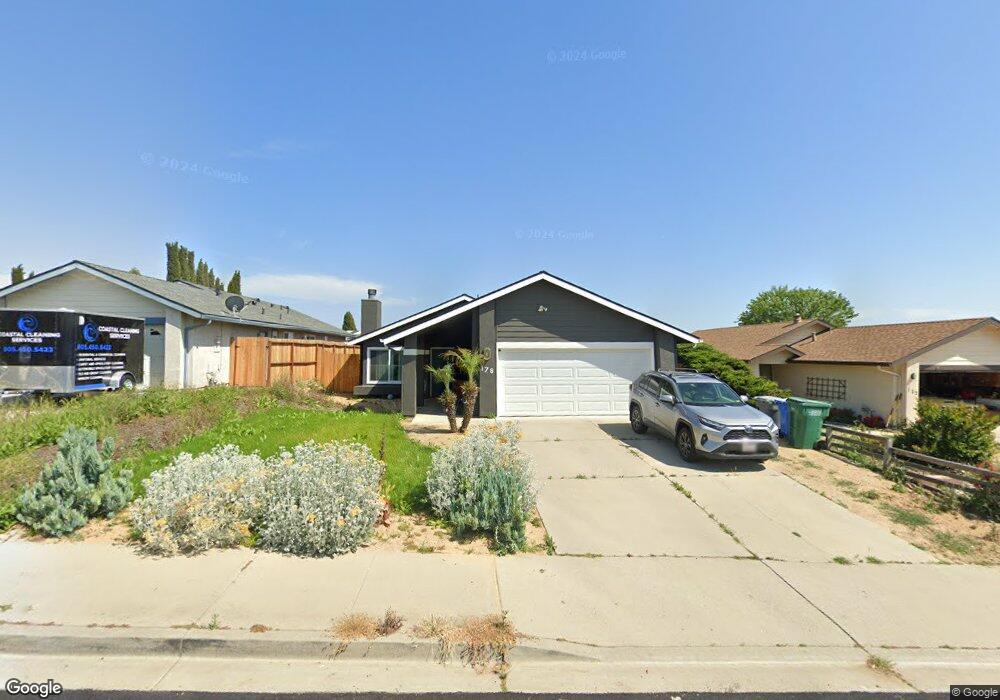
178 E Vintage St Nipomo, CA 93444
Estimated Value: $616,221 - $659,000
3
Beds
2
Baths
1,220
Sq Ft
$525/Sq Ft
Est. Value
About This Home
This home is located at 178 E Vintage St, Nipomo, CA 93444 and is currently estimated at $640,555, approximately $525 per square foot. 178 E Vintage St is a home located in San Luis Obispo County with nearby schools including Nipomo Elementary School, Mesa Middle School, and Nipomo High School.
Ownership History
Date
Name
Owned For
Owner Type
Purchase Details
Closed on
Feb 5, 2021
Sold by
Harrigan Scott and Harrigan Kiley
Bought by
Harrigan Scott
Current Estimated Value
Home Financials for this Owner
Home Financials are based on the most recent Mortgage that was taken out on this home.
Original Mortgage
$350,020
Interest Rate
2.9%
Mortgage Type
FHA
Purchase Details
Closed on
Jul 25, 2002
Sold by
Harrigan Scott and Harrigan Kiley
Bought by
Harrigan Scott and Harrigan Kiley
Home Financials for this Owner
Home Financials are based on the most recent Mortgage that was taken out on this home.
Original Mortgage
$197,848
Interest Rate
6.6%
Mortgage Type
FHA
Purchase Details
Closed on
Jun 28, 2001
Sold by
Ringo Thomas M and Ringo Susan M
Bought by
Harrigan Scott and Harrigan Kiley
Home Financials for this Owner
Home Financials are based on the most recent Mortgage that was taken out on this home.
Original Mortgage
$199,371
Interest Rate
7.15%
Mortgage Type
FHA
Create a Home Valuation Report for This Property
The Home Valuation Report is an in-depth analysis detailing your home's value as well as a comparison with similar homes in the area
Home Values in the Area
Average Home Value in this Area
Purchase History
We collect this data history from publicly available records. To have your information removed, we recommend requesting removal directly through your county’s website.
| Date | Buyer | Sale Price | Title Company |
|---|---|---|---|
| Harrigan Scott | -- | Chicago Title | |
| Harrigan Scott | -- | Cuesta Title Company | |
| Harrigan Scott | $202,500 | Fidelity National Title Co |
Source: Public Records
Mortgage History
We collect this data history from publicly available records. To have your information removed, we recommend requesting removal directly through your county’s website.
| Date | Status | Borrower | Loan Amount |
|---|---|---|---|
| Previous Owner | Harrigan Scott | $350,020 | |
| Previous Owner | Harrigan Scott | $197,848 | |
| Previous Owner | Harrigan Scott | $199,371 |
Source: Public Records
Tax History
| Year | Tax Paid | Tax Assessment Tax Assessment Total Assessment is a certain percentage of the fair market value that is determined by local assessors to be the total taxable value of land and additions on the property. | Land | Improvement |
|---|---|---|---|---|
| 2025 | $3,077 | $299,127 | $132,943 | $166,184 |
| 2024 | $3,042 | $293,263 | $130,337 | $162,926 |
| 2023 | $3,042 | $287,514 | $127,782 | $159,732 |
| 2022 | $2,996 | $281,877 | $125,277 | $156,600 |
| 2021 | $2,990 | $276,351 | $122,821 | $153,530 |
| 2020 | $2,956 | $273,518 | $121,562 | $151,956 |
| 2019 | $2,938 | $268,156 | $119,179 | $148,977 |
| 2018 | $2,903 | $262,899 | $116,843 | $146,056 |
| 2017 | $2,849 | $257,745 | $114,552 | $143,193 |
| 2016 | $2,687 | $252,692 | $112,306 | $140,386 |
| 2015 | $2,648 | $248,898 | $110,620 | $138,278 |
| 2014 | $2,550 | $244,024 | $108,454 | $135,570 |
Source: Public Records
Map
Nearby Homes
- 215 Rancho Rd
- 0 S Burton St
- 285 E Tefft St
- 182 E Chestnut St
- 150 E Chestnut St
- 205 W Tefft St
- 267 W Tefft St
- 449 W Tefft St Unit 41
- 449 W Tefft St Unit 7
- 449 W Tefft St Unit 13
- 544 S Oakglen Ave
- 571 S Oakglen Ave
- 584 S Oakglen Ave
- 400 N Oakglen Ave
- 160 San Antonio Ln
- 545 Grande St
- 549 Hill St
- 511 Avenida Montecito Verde
- 181 Jerome Ct
- 224 Scarlett Cir
- 184 E Vintage St
- 172 E Vintage St
- 190 E Vintage St
- 166 E Vintage St
- 179 E Knotts St
- 160 E Vintage St
- 196 E Vintage St
- 185 E Knotts St
- 173 E Knotts St
- 191 E Knotts St
- 167 E Knotts St
- 154 E Vintage St
- 179 E Vintage St
- 202 E Vintage St
- 161 E Knotts St
- 173 E Vintage St
- 185 E Vintage St
- 197 E Knotts St
- 191 E Vintage St
- 167 E Vintage St
Your Personal Tour Guide
Ask me questions while you tour the home.