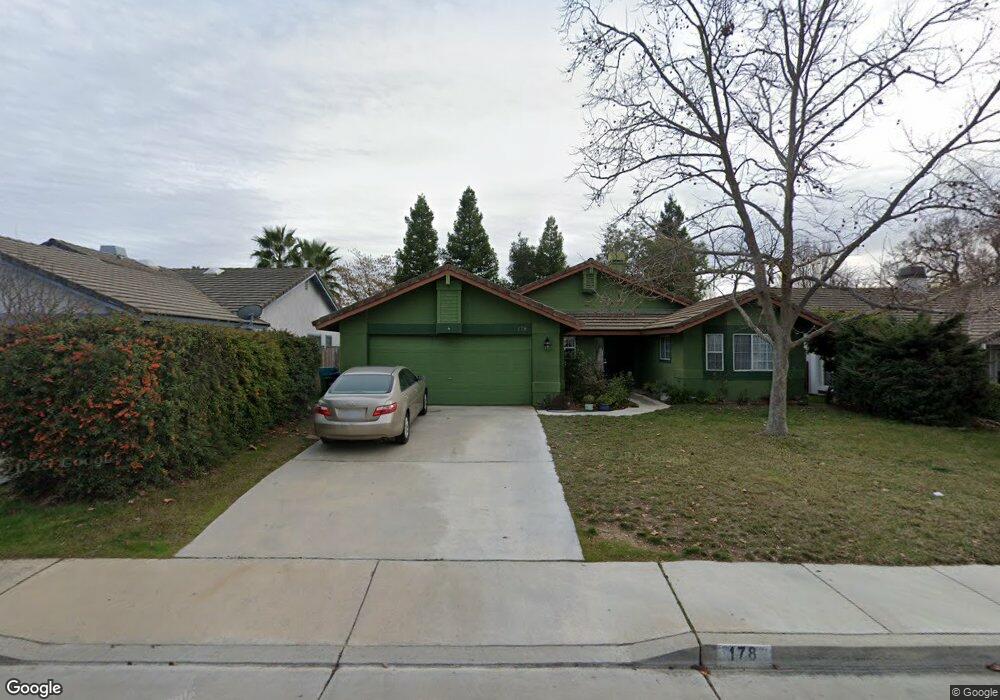
178 Edgewater Ln Paso Robles, CA 93446
Estimated Value: $654,097 - $752,000
3
Beds
2
Baths
1,430
Sq Ft
$484/Sq Ft
Est. Value
About This Home
This home is located at 178 Edgewater Ln, Paso Robles, CA 93446 and is currently estimated at $692,774, approximately $484 per square foot. 178 Edgewater Ln is a home located in San Luis Obispo County with nearby schools including Pat Butler Elementary School, George H. Flamson Middle School, and Paso Robles High School.
Ownership History
Date
Name
Owned For
Owner Type
Purchase Details
Closed on
Aug 24, 2020
Sold by
Cooper Robert E
Bought by
Cooper Sharon R
Current Estimated Value
Home Financials for this Owner
Home Financials are based on the most recent Mortgage that was taken out on this home.
Original Mortgage
$188,500
Outstanding Balance
$166,836
Interest Rate
3%
Mortgage Type
New Conventional
Estimated Equity
$525,938
Purchase Details
Closed on
Apr 5, 2011
Sold by
Belk Karen A and Belk Richard L
Bought by
Cooper Robert E and Cooper Sharon R
Home Financials for this Owner
Home Financials are based on the most recent Mortgage that was taken out on this home.
Original Mortgage
$215,600
Interest Rate
4.84%
Mortgage Type
New Conventional
Purchase Details
Closed on
Sep 10, 2002
Sold by
Seidler Karen A
Bought by
Belk Richard L and Belk Karen A
Home Financials for this Owner
Home Financials are based on the most recent Mortgage that was taken out on this home.
Original Mortgage
$123,000
Interest Rate
6.22%
Create a Home Valuation Report for This Property
The Home Valuation Report is an in-depth analysis detailing your home's value as well as a comparison with similar homes in the area
Purchase History
| Date | Buyer | Sale Price | Title Company |
|---|---|---|---|
| Cooper Robert E | $269,500 | First American Title Company | |
| Belk Richard L | -- | Fidelity Title Company | |
| Cooper Sharon R | -- | -- |
Source: Public Records
Mortgage History
| Date | Status | Borrower | Loan Amount |
|---|---|---|---|
| Open | Cooper Sharon R | $188,500 | |
| Previous Owner | Cooper Robert E | $215,600 | |
| Previous Owner | Belk Richard L | $123,000 |
Source: Public Records
Tax History
| Year | Tax Paid | Tax Assessment Tax Assessment Total Assessment is a certain percentage of the fair market value that is determined by local assessors to be the total taxable value of land and additions on the property. | Land | Improvement |
|---|---|---|---|---|
| 2025 | $3,817 | $345,263 | $166,547 | $178,716 |
| 2024 | $3,752 | $338,494 | $163,282 | $175,212 |
| 2023 | $3,752 | $331,858 | $160,081 | $171,777 |
| 2022 | $3,682 | $325,352 | $156,943 | $168,409 |
| 2021 | $3,620 | $318,973 | $153,866 | $165,107 |
| 2020 | $3,569 | $315,704 | $152,289 | $163,415 |
| 2019 | $3,516 | $309,514 | $149,303 | $160,211 |
| 2018 | $3,468 | $303,446 | $146,376 | $157,070 |
| 2017 | $3,266 | $297,497 | $143,506 | $153,991 |
| 2016 | $3,199 | $291,665 | $140,693 | $150,972 |
| 2015 | $3,186 | $287,285 | $138,580 | $148,705 |
| 2014 | $3,077 | $281,659 | $135,866 | $145,793 |
Source: Public Records
Map
Nearby Homes
- 176 Edgewater Ln
- 180 Edgewater Ln
- 181 Riverbank Ln
- 174 Edgewater Ln
- 182 Edgewater Ln
- 183 Riverbank Ln
- 179 Riverbank Ln
- 185 Riverbank Ln
- 177 Edgewater Ln
- 179 Edgewater Ln
- 172 Edgewater Ln
- 184 Edgewater Ln
- 175 Edgewater Ln
- 177 Riverbank Ln
- 181 Edgewater Ln
- 187 Riverbank Ln
- 173 Edgewater Ln
- 183 Edgewater Ln
- 175 Riverbank Ln
- 170 Edgewater Ln
Your Personal Tour Guide
Ask me questions while you tour the home.