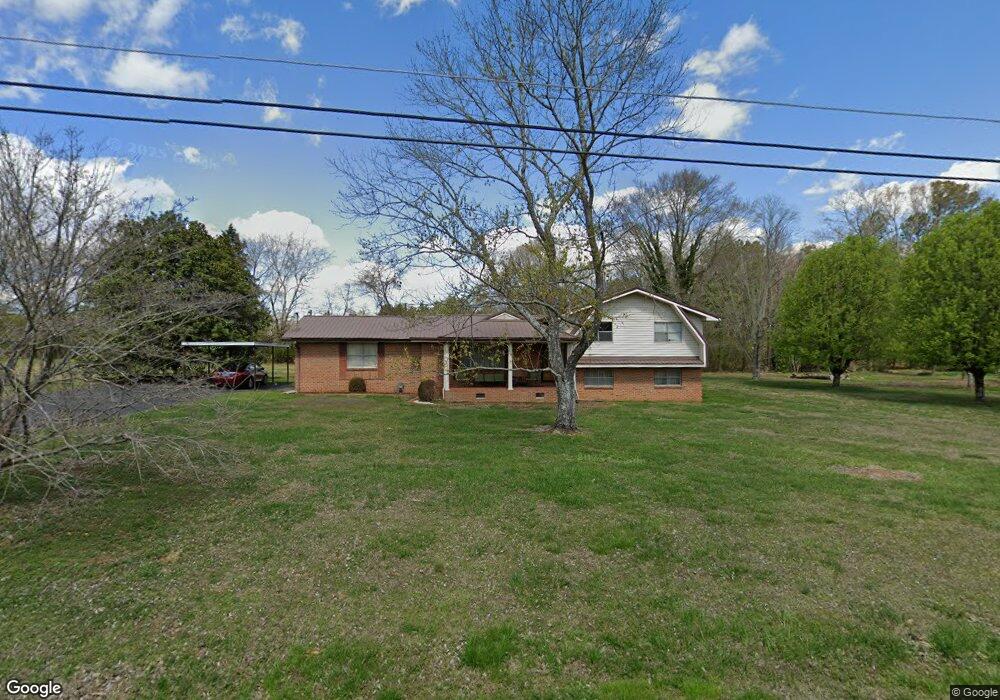
178 Graham Cir Rock Spring, GA 30739
Rock Spring NeighborhoodEstimated Value: $262,190 - $434,000
--
Bed
2
Baths
1,807
Sq Ft
$180/Sq Ft
Est. Value
About This Home
This home is located at 178 Graham Cir, Rock Spring, GA 30739 and is currently estimated at $325,798, approximately $180 per square foot. 178 Graham Cir is a home located in Walker County with nearby schools including Rock Spring Elementary School, Lafayette High School, and Alice M Daley Adventist School.
Ownership History
Date
Name
Owned For
Owner Type
Purchase Details
Closed on
Sep 21, 2006
Sold by
Us Bank
Bought by
Wilbanks Derek Heath
Current Estimated Value
Purchase Details
Closed on
Oct 22, 1987
Sold by
Southeast Federal Savings Bank
Bought by
Wilbanks Horace W and Wilbanks Sherry G
Purchase Details
Closed on
Mar 6, 1987
Sold by
Crouch Janice E
Bought by
Southeast Federal Savings Bank
Purchase Details
Closed on
Jul 30, 1985
Sold by
Crouch Donald E and Wf Janice
Bought by
Crouch Janice E
Purchase Details
Closed on
May 27, 1983
Sold by
Logan Donald L
Bought by
Crouch Donald E and Wf Janice
Purchase Details
Closed on
Nov 1, 1979
Sold by
Harris Maryetta
Bought by
Logan Donald L
Purchase Details
Closed on
Apr 16, 1974
Sold by
Harris John Russell and Harris Maryett
Bought by
Harris Maryetta
Purchase Details
Closed on
Sep 18, 1973
Bought by
Harris John Russell and Harris Maryett
Create a Home Valuation Report for This Property
The Home Valuation Report is an in-depth analysis detailing your home's value as well as a comparison with similar homes in the area
Home Values in the Area
Average Home Value in this Area
Purchase History
| Date | Buyer | Sale Price | Title Company |
|---|---|---|---|
| Wilbanks Derek Heath | $70,000 | -- | |
| Wilbanks Horace W | $54,900 | -- | |
| Southeast Federal Savings Bank | $47,000 | -- | |
| Crouch Janice E | -- | -- | |
| Crouch Donald E | -- | -- | |
| Logan Donald L | -- | -- | |
| Harris Maryetta | -- | -- | |
| Harris John Russell | -- | -- |
Source: Public Records
Tax History Compared to Growth
Tax History
| Year | Tax Paid | Tax Assessment Tax Assessment Total Assessment is a certain percentage of the fair market value that is determined by local assessors to be the total taxable value of land and additions on the property. | Land | Improvement |
|---|---|---|---|---|
| 2024 | $332 | $108,152 | $10,500 | $97,652 |
| 2023 | $334 | $103,000 | $10,500 | $92,500 |
| 2022 | $271 | $90,688 | $10,500 | $80,188 |
| 2021 | $486 | $75,655 | $10,500 | $65,155 |
| 2020 | $280 | $63,631 | $10,500 | $53,131 |
| 2019 | $281 | $63,631 | $10,500 | $53,131 |
| 2018 | $1,684 | $63,631 | $10,500 | $53,131 |
| 2017 | $505 | $63,842 | $10,500 | $53,342 |
| 2016 | $224 | $63,842 | $10,500 | $53,342 |
| 2015 | $163 | $55,412 | $13,860 | $41,552 |
| 2014 | $95 | $55,412 | $13,860 | $41,552 |
| 2013 | -- | $55,412 | $13,860 | $41,552 |
Source: Public Records
Map
Nearby Homes
- 10180 Us Highway 27
- 1003 Highway N Old 27
- 1370 Old Highway 27
- 5602 Georgia 95
- 00 Georgia 95
- 701 Bicentennial Trail
- 23 Willow Cir
- 16 Willow Cir
- 11 Willow Cir
- The Pearson Plan at Laurel Ridge
- The Benson II Plan at Laurel Ridge
- The Langford Plan at Laurel Ridge
- The Lawson Plan at Laurel Ridge
- The Coleman Plan at Laurel Ridge
- The McGinnis Plan at Laurel Ridge
- The Caldwell Plan at Laurel Ridge
- 1902 Long Hollow Rd
- 0 Veeler Rd Unit 1522679
- 0 Veeler Rd Unit 10628696
- 234 Dad Taylor Dr
- 148 Graham Cir
- 191 Graham Cir
- 115 Graham Cir
- 238 Graham Cir
- 118 Graham Cir
- 267 Graham Cir
- 138 Graham Cir
- 7092 Us Highway 27
- 7142 N Highway 27
- 108 Graham Cir
- 7092 N Highway 27
- 7154 N Highway 27
- 289 Graham Cir
- 7158 N Highway 27
- 1476 Us Highway 27
- 10161 Us Highway 27
- 17 Us Highway 27
- 0 Us Highway 27
- 309 Graham Cir
- 309 Graham Cir