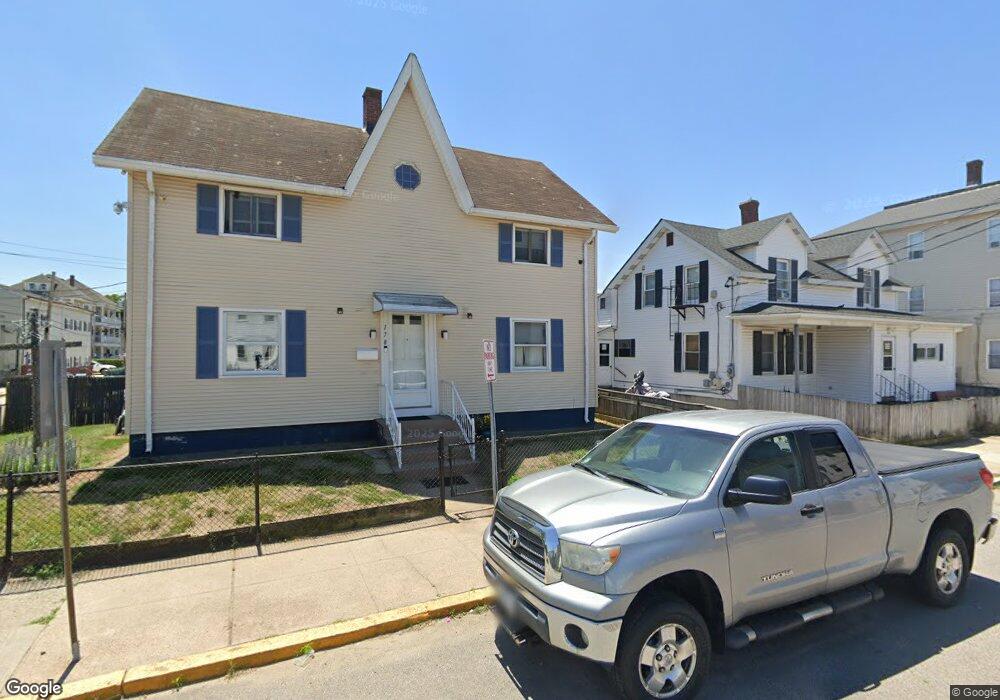
178 Harrison St Pawtucket, RI 02860
Downtown Pawtucket NeighborhoodEstimated Value: $470,647 - $585,000
2
Beds
2
Baths
1,328
Sq Ft
$390/Sq Ft
Est. Value
About This Home
This home is located at 178 Harrison St, Pawtucket, RI 02860 and is currently estimated at $517,412, approximately $389 per square foot. 178 Harrison St is a home located in Providence County with nearby schools including International Charter School, Blackstone Valley Prep Junior High School, and Blackstone Academy Charter School.
Ownership History
Date
Name
Owned For
Owner Type
Purchase Details
Closed on
Sep 8, 2021
Sold by
Mathieu Ronald P
Bought by
Mathieu Ronald P and Mathieu Lynn M
Current Estimated Value
Purchase Details
Closed on
May 5, 2000
Sold by
Mathieu Gisele L Est
Bought by
Mathieu Roland P
Home Financials for this Owner
Home Financials are based on the most recent Mortgage that was taken out on this home.
Original Mortgage
$64,400
Interest Rate
8.21%
Create a Home Valuation Report for This Property
The Home Valuation Report is an in-depth analysis detailing your home's value as well as a comparison with similar homes in the area
Home Values in the Area
Average Home Value in this Area
Purchase History
| Date | Buyer | Sale Price | Title Company |
|---|---|---|---|
| Mathieu Ronald P | -- | None Available | |
| Mathieu Roland P | $71,000 | -- |
Source: Public Records
Mortgage History
| Date | Status | Borrower | Loan Amount |
|---|---|---|---|
| Previous Owner | Mathieu Roland P | $85,000 | |
| Previous Owner | Mathieu Roland P | $50,000 | |
| Previous Owner | Mathieu Roland P | $101,000 | |
| Previous Owner | Mathieu Roland P | $64,400 |
Source: Public Records
Tax History
| Year | Tax Paid | Tax Assessment Tax Assessment Total Assessment is a certain percentage of the fair market value that is determined by local assessors to be the total taxable value of land and additions on the property. | Land | Improvement |
|---|---|---|---|---|
| 2025 | $4,282 | $325,600 | $118,800 | $206,800 |
| 2024 | $4,018 | $325,600 | $118,800 | $206,800 |
| 2023 | $3,422 | $202,000 | $53,500 | $148,500 |
| 2022 | $3,349 | $202,000 | $53,500 | $148,500 |
| 2021 | $3,349 | $202,000 | $53,500 | $148,500 |
| 2020 | $3,244 | $155,300 | $54,200 | $101,100 |
| 2019 | $3,244 | $155,300 | $54,200 | $101,100 |
| 2018 | $3,126 | $155,300 | $54,200 | $101,100 |
| 2017 | $2,804 | $123,400 | $41,200 | $82,200 |
| 2016 | $2,701 | $123,400 | $41,200 | $82,200 |
| 2015 | $2,701 | $123,400 | $41,200 | $82,200 |
| 2014 | $2,968 | $128,700 | $53,000 | $75,700 |
Source: Public Records
Map
Nearby Homes
- 184 Harrison St
- 170 Harrison St
- 31 Bagley St
- 22 Bagley St
- 186 Harrison St
- 45 Capital St
- 168 Harrison St
- 181 Harrison St
- 185 Harrison St
- 23 Bagley St
- 190 Harrison St
- 171 Harrison St
- 31 Capital St
- 31 Capital St Unit 1st floor
- 51 Capital St
- 183 Harrison St
- 191 Harrison St
- 162 Harrison St
- 48 Bagley St
- 194 Harrison St
Your Personal Tour Guide
Ask me questions while you tour the home.