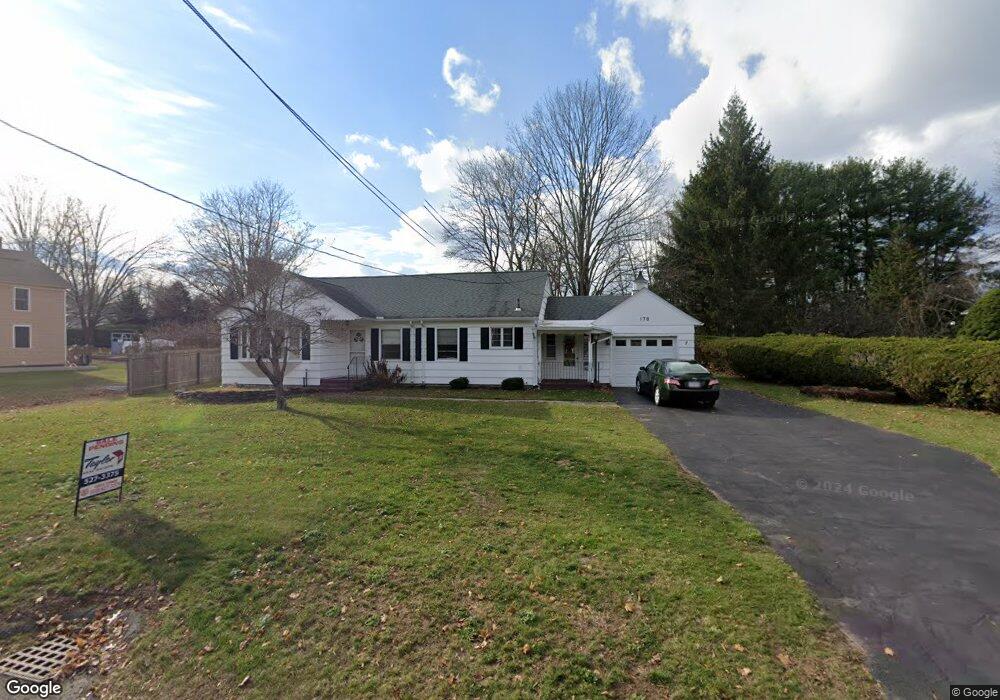
178 Hendrick St Easthampton, MA 01027
Estimated Value: $375,222 - $390,000
3
Beds
2
Baths
1,294
Sq Ft
$296/Sq Ft
Est. Value
About This Home
This home is located at 178 Hendrick St, Easthampton, MA 01027 and is currently estimated at $382,806, approximately $295 per square foot. 178 Hendrick St is a home located in Hampshire County with nearby schools including Easthampton High School, Tri-County Schools, and New England Adolescent Research Institute.
Ownership History
Date
Name
Owned For
Owner Type
Purchase Details
Closed on
Nov 30, 2020
Sold by
Lamothe Laura A and Guzik John A
Bought by
Stjohn Timothy M and Stjohn Angela M
Current Estimated Value
Home Financials for this Owner
Home Financials are based on the most recent Mortgage that was taken out on this home.
Original Mortgage
$244,625
Outstanding Balance
$218,178
Interest Rate
2.8%
Mortgage Type
New Conventional
Estimated Equity
$164,628
Purchase Details
Closed on
Apr 1, 2014
Sold by
Guzik Shirley E
Bought by
Lamothe Laura A and Guzik Glenn A
Purchase Details
Closed on
Jan 22, 2014
Sold by
Guzik Shirley E
Bought by
Lamothe Laura A and Guzik Glenn A
Create a Home Valuation Report for This Property
The Home Valuation Report is an in-depth analysis detailing your home's value as well as a comparison with similar homes in the area
Home Values in the Area
Average Home Value in this Area
Purchase History
| Date | Buyer | Sale Price | Title Company |
|---|---|---|---|
| Stjohn Timothy M | $257,500 | None Available | |
| Lamothe Laura A | -- | -- | |
| Lamothe Laura A | -- | -- |
Source: Public Records
Mortgage History
| Date | Status | Borrower | Loan Amount |
|---|---|---|---|
| Open | Stjohn Timothy M | $244,625 |
Source: Public Records
Tax History Compared to Growth
Tax History
| Year | Tax Paid | Tax Assessment Tax Assessment Total Assessment is a certain percentage of the fair market value that is determined by local assessors to be the total taxable value of land and additions on the property. | Land | Improvement |
|---|---|---|---|---|
| 2025 | $4,607 | $337,000 | $122,800 | $214,200 |
| 2024 | $4,446 | $327,900 | $119,200 | $208,700 |
| 2023 | $3,545 | $242,000 | $94,400 | $147,600 |
| 2022 | $4,000 | $242,000 | $94,400 | $147,600 |
| 2021 | $4,113 | $249,400 | $94,400 | $155,000 |
| 2020 | $4,298 | $242,000 | $94,400 | $147,600 |
| 2019 | $3,458 | $223,700 | $94,400 | $129,300 |
| 2018 | $3,322 | $207,600 | $89,300 | $118,300 |
| 2017 | $3,239 | $199,800 | $85,600 | $114,200 |
| 2016 | $3,115 | $199,800 | $85,600 | $114,200 |
| 2015 | $3,027 | $199,800 | $85,600 | $114,200 |
Source: Public Records
Map
Nearby Homes