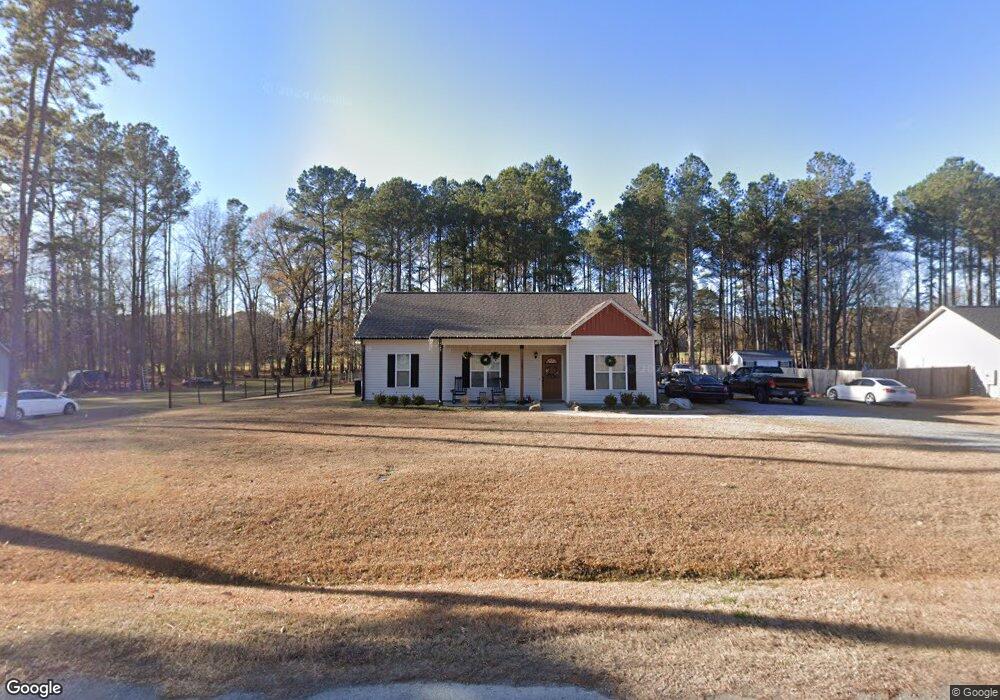
178 Jon Dr Unit 43R Smithfield, NC 27577
Estimated Value: $253,000 - $284,000
3
Beds
2
Baths
1,140
Sq Ft
$231/Sq Ft
Est. Value
About This Home
This home is located at 178 Jon Dr Unit 43R, Smithfield, NC 27577 and is currently estimated at $262,940, approximately $230 per square foot. 178 Jon Dr Unit 43R is a home located in Johnston County with nearby schools including West Smithfield Elementary School, Smithfield Middle School, and Smithfield-Selma High School.
Ownership History
Date
Name
Owned For
Owner Type
Purchase Details
Closed on
Apr 20, 2017
Sold by
Js&S Development Inc
Bought by
Guardado Elvin J Munguia
Current Estimated Value
Home Financials for this Owner
Home Financials are based on the most recent Mortgage that was taken out on this home.
Original Mortgage
$124,208
Outstanding Balance
$104,498
Interest Rate
4.62%
Mortgage Type
FHA
Estimated Equity
$158,442
Create a Home Valuation Report for This Property
The Home Valuation Report is an in-depth analysis detailing your home's value as well as a comparison with similar homes in the area
Home Values in the Area
Average Home Value in this Area
Purchase History
| Date | Buyer | Sale Price | Title Company |
|---|---|---|---|
| Guardado Elvin J Munguia | $126,500 | -- |
Source: Public Records
Mortgage History
| Date | Status | Borrower | Loan Amount |
|---|---|---|---|
| Open | Guardado Elvin J Munguia | $124,208 |
Source: Public Records
Tax History
| Year | Tax Paid | Tax Assessment Tax Assessment Total Assessment is a certain percentage of the fair market value that is determined by local assessors to be the total taxable value of land and additions on the property. | Land | Improvement |
|---|---|---|---|---|
| 2025 | $1,584 | $249,380 | $53,550 | $195,830 |
| 2024 | $1,004 | $123,930 | $28,240 | $95,690 |
| 2023 | $1,004 | $123,930 | $28,240 | $95,690 |
| 2022 | $1,029 | $123,930 | $28,240 | $95,690 |
| 2021 | $1,029 | $123,930 | $28,240 | $95,690 |
| 2020 | $1,041 | $123,930 | $28,240 | $95,690 |
| 2019 | $1,041 | $123,930 | $28,240 | $95,690 |
| 2018 | $912 | $106,070 | $23,860 | $82,210 |
| 2017 | $570 | $66,240 | $23,860 | $42,380 |
| 2016 | $205 | $23,860 | $23,860 | $0 |
| 2015 | $205 | $23,860 | $23,860 | $0 |
| 2014 | $205 | $23,860 | $23,860 | $0 |
Source: Public Records
Map
Nearby Homes
- 224 Cherokee Cir
- 41 Clipper Ln
- 136 Tuskeegee Dr Unit (Lot 38)
- 136 Tuskeegee Dr
- 108 Tuskeegee Dr Unit (Lot 37)
- 108 Tuskeegee Dr
- 207 Tuskeegee Dr Unit (Lot 42)
- 207 Tuskeegee Dr
- 187 Tuskeegee Dr
- 187 Tuskeegee Dr Unit (Lot 44)
- 83 Tuskeegee Dr
- 83 Tuskeegee Dr Unit (Lot 49)
- 41 Tuskeegee Dr Unit (Lot 51)
- 41 Tuskeegee Dr
- 213 Yardley Dr Unit (Lot 68)
- 139 Yardley Dr Unit (Lot 74)
- 203 Yardley Dr
- 203 Yardley Dr Unit (Lot 69)
- 139 Yardley Dr
- 262 Yardley Dr Unit (Lot 64)
Your Personal Tour Guide
Ask me questions while you tour the home.