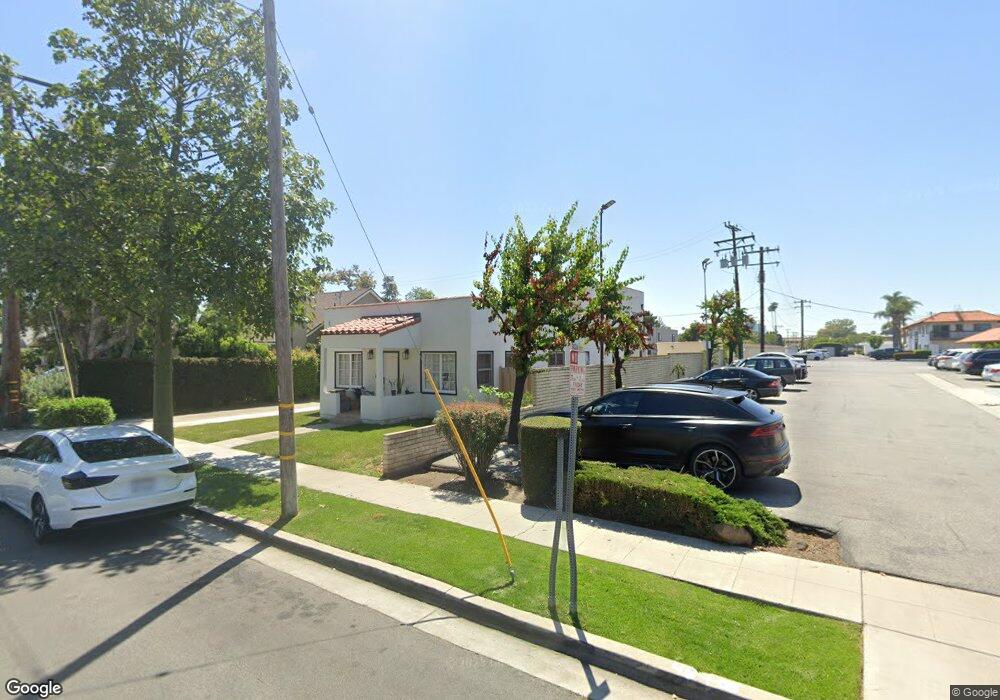
178 N B St Unit 1 Tustin, CA 92780
Estimated Value: $622,000 - $1,170,000
3
Beds
2
Baths
1,150
Sq Ft
$805/Sq Ft
Est. Value
About This Home
This home is located at 178 N B St Unit 1, Tustin, CA 92780 and is currently estimated at $925,504, approximately $804 per square foot. 178 N B St Unit 1 is a home located in Orange County with nearby schools including Helen Estock Elementary School, Columbus Tustin Middle School, and Foothill High School.
Ownership History
Date
Name
Owned For
Owner Type
Purchase Details
Closed on
May 20, 2021
Sold by
Nguyen Dieu Hoang and Nguyen Cam Hong
Bought by
Nguyen Khoian Gina
Current Estimated Value
Home Financials for this Owner
Home Financials are based on the most recent Mortgage that was taken out on this home.
Original Mortgage
$400,000
Outstanding Balance
$361,933
Interest Rate
3%
Mortgage Type
New Conventional
Estimated Equity
$563,571
Purchase Details
Closed on
Jun 29, 2020
Sold by
Platinum Enterprises
Bought by
Nguyen Dieu Hoang and Nguyen Cam Hong
Purchase Details
Closed on
Dec 28, 2019
Sold by
Kamiya Tadao and Kamiya Mitsuko
Bought by
Platinum Enterprises
Purchase Details
Closed on
Sep 15, 1994
Sold by
Kamiya Tadao and Kamiya Mitsuko
Bought by
Kamiya Tadao and Kamiya Mitsuko
Create a Home Valuation Report for This Property
The Home Valuation Report is an in-depth analysis detailing your home's value as well as a comparison with similar homes in the area
Home Values in the Area
Average Home Value in this Area
Purchase History
| Date | Buyer | Sale Price | Title Company |
|---|---|---|---|
| Nguyen Khoian Gina | -- | Wfg National Title Company | |
| Nguyen Dieu Hoang | $478,000 | Netco Title Company | |
| Platinum Enterprises | $355,000 | First American Title Company | |
| Kamiya Tadao | -- | -- |
Source: Public Records
Mortgage History
| Date | Status | Borrower | Loan Amount |
|---|---|---|---|
| Open | Nguyen Khoian Gina | $400,000 |
Source: Public Records
Tax History Compared to Growth
Tax History
| Year | Tax Paid | Tax Assessment Tax Assessment Total Assessment is a certain percentage of the fair market value that is determined by local assessors to be the total taxable value of land and additions on the property. | Land | Improvement |
|---|---|---|---|---|
| 2025 | $9,395 | $837,346 | $464,915 | $372,431 |
| 2024 | $9,395 | $820,928 | $455,799 | $365,129 |
| 2023 | $5,397 | $497,311 | $446,862 | $50,449 |
| 2022 | $5,799 | $487,560 | $438,100 | $49,460 |
| 2021 | $5,760 | $478,000 | $429,509 | $48,491 |
| 2020 | $6,448 | $540,000 | $491,661 | $48,339 |
| 2019 | $2,430 | $167,202 | $125,596 | $41,606 |
| 2018 | $2,394 | $163,924 | $123,133 | $40,791 |
| 2017 | $2,357 | $160,710 | $120,718 | $39,992 |
| 2016 | $2,319 | $157,559 | $118,351 | $39,208 |
| 2015 | $2,449 | $155,193 | $116,573 | $38,620 |
| 2014 | $2,394 | $152,153 | $114,289 | $37,864 |
Source: Public Records
Map
Nearby Homes
- 160 N B St
- 428 W 1st St
- 119 Jessup Way
- 282 Prospect Park
- 139 Jessup Way
- 17601 Sherbrook Dr
- 453 E 1st St
- 17841 Lucero Way
- 17902 Lucero Way
- 654 W Main St Unit B
- 631 W 6th St Unit D
- 14291 Prospect Ave
- 1042 San Juan St
- 17522 Vandenberg Ln Unit 3
- 141 E Coronado Ln
- 1091 Bonita St
- 1112 1114 Napa St
- 18101 Kirk Ave
- Plan 1642 at Stafford Glen
- Plan 1643 Modeled at Stafford Glen