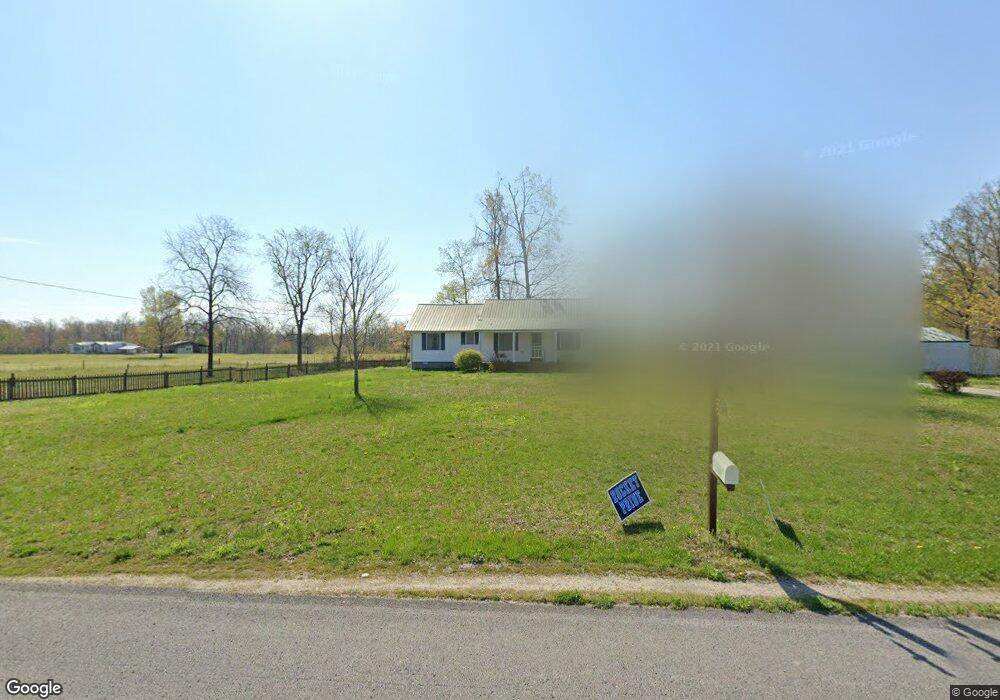
1780 Farrar Hill Rd Manchester, TN 37355
Estimated Value: $209,324 - $263,000
--
Bed
2
Baths
1,236
Sq Ft
$200/Sq Ft
Est. Value
About This Home
This home is located at 1780 Farrar Hill Rd, Manchester, TN 37355 and is currently estimated at $247,581, approximately $200 per square foot. 1780 Farrar Hill Rd is a home located in Coffee County with nearby schools including North Coffee Elementary School, Coffee County Middle School, and Coffee County Central High School.
Ownership History
Date
Name
Owned For
Owner Type
Purchase Details
Closed on
Jan 11, 2021
Sold by
Ferrell Susan
Bought by
Ferrell Abby
Current Estimated Value
Home Financials for this Owner
Home Financials are based on the most recent Mortgage that was taken out on this home.
Original Mortgage
$145,000
Outstanding Balance
$129,413
Interest Rate
2.71%
Mortgage Type
New Conventional
Estimated Equity
$118,168
Purchase Details
Closed on
Oct 9, 2019
Sold by
Fowler Glen L
Bought by
Ferrell Abby and Ferrell Susan
Home Financials for this Owner
Home Financials are based on the most recent Mortgage that was taken out on this home.
Original Mortgage
$142,000
Interest Rate
3.5%
Mortgage Type
Commercial
Purchase Details
Closed on
Dec 14, 2006
Bought by
Fowler Glenn L
Purchase Details
Closed on
Apr 28, 2006
Bought by
Teal Woodrow
Purchase Details
Closed on
Jul 30, 1997
Sold by
Teal Reba D
Bought by
Teal Winfred B and Teal Charlotte
Purchase Details
Closed on
Apr 10, 1997
Sold by
Teal Woodrow
Bought by
Teal Reba D
Create a Home Valuation Report for This Property
The Home Valuation Report is an in-depth analysis detailing your home's value as well as a comparison with similar homes in the area
Home Values in the Area
Average Home Value in this Area
Purchase History
| Date | Buyer | Sale Price | Title Company |
|---|---|---|---|
| Ferrell Abby | -- | None Available | |
| Ferrell Abby | $145,000 | Bell & Alexander Ttl Svcs In | |
| Fowler Glenn L | $51,000 | -- | |
| Teal Woodrow | $38,000 | -- | |
| Teal Winfred B | $20,000 | -- | |
| Teal Reba D | $8,000 | -- |
Source: Public Records
Mortgage History
| Date | Status | Borrower | Loan Amount |
|---|---|---|---|
| Open | Ferrell Abby | $145,000 | |
| Closed | Ferrell Abby | $142,000 |
Source: Public Records
Tax History Compared to Growth
Tax History
| Year | Tax Paid | Tax Assessment Tax Assessment Total Assessment is a certain percentage of the fair market value that is determined by local assessors to be the total taxable value of land and additions on the property. | Land | Improvement |
|---|---|---|---|---|
| 2024 | $774 | $33,225 | $10,950 | $22,275 |
| 2023 | $774 | $33,225 | $0 | $0 |
| 2022 | $774 | $33,225 | $10,950 | $22,275 |
| 2021 | $670 | $22,850 | $6,875 | $15,975 |
| 2020 | $670 | $22,850 | $6,875 | $15,975 |
| 2019 | $670 | $22,850 | $6,875 | $15,975 |
| 2018 | $658 | $22,850 | $6,875 | $15,975 |
| 2017 | $658 | $20,175 | $6,075 | $14,100 |
| 2016 | $658 | $20,175 | $6,075 | $14,100 |
| 2015 | $658 | $20,175 | $6,075 | $14,100 |
| 2014 | $658 | $20,167 | $0 | $0 |
Source: Public Records
Map
Nearby Homes
- 559 Geneva Boynton Rd
- 426 Allie Boynton Dr
- 3325 Farrar Hill Rd
- 250 Shelley Rd
- 7130 Murfreesboro Hwy Unit 7130
- 7111 Murfreesboro Hwy
- 0 Walter Barnes Ln
- 0 Oneal Hollow Ln
- 637 N Ballard Rd
- 0 Noah Rd
- 1 Noah Rd
- 0 Noah Rd
- 0 Panhandle Rd
- 0 Panhandle Rd Unit RTC3037634
- 171 George Hill Rd
- 426 Fern Gully Ln
- 481 Matts Hollow Rd
- 8651 Fredonia Rd
- 0 Cole Ridge Rd Unit RTC2973743
- 0 Cole Ridge Rd Unit RTC2531391
- 1811 Farrar Hill Rd
- 1864 Farrar Hill Rd
- 1864 Farrar Hill Rd
- 1923 Farrar Hill Rd
- 5 Farrar Hill Rd
- 2049 Farrar Hill Rd
- 137 Morton Rd
- 179 Morton Rd
- 218 Morton Rd
- 2048 Farrar Hill Rd
- 0 Farrrah Hill Rd
- 219 Morton Rd
- 136 Victor Ln
- 1481 Farrar Hill Rd
- 124 Morton Rd
- 150 Morton Rd
- 172 Morton Rd
- 531 N Fork Rd
- 1418 Farrar Hill Rd
- 241 Victor Ln