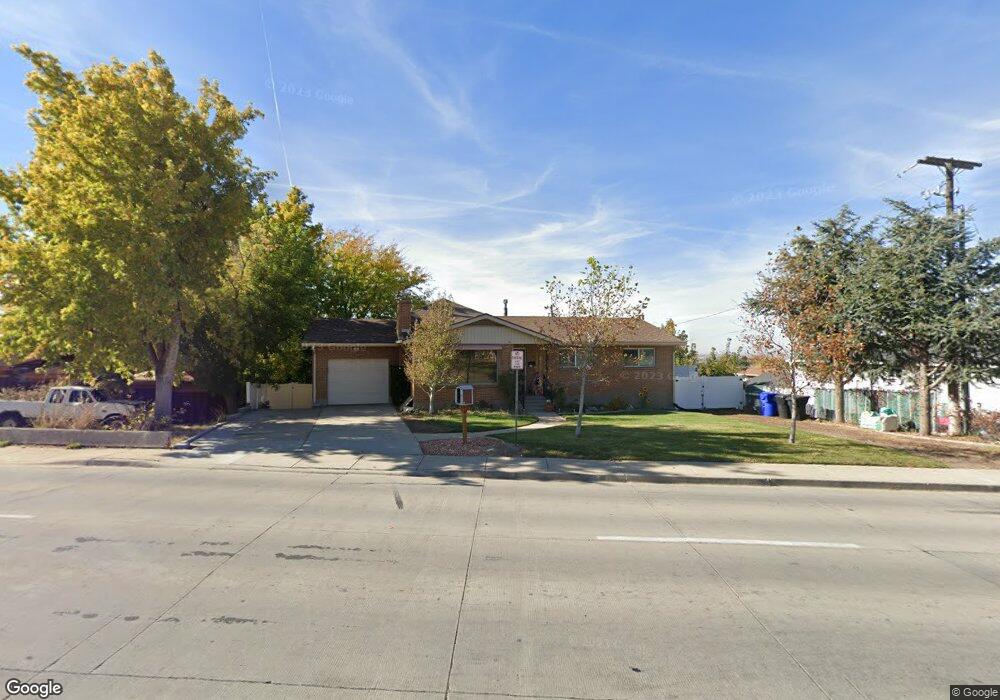
1780 Orchard Dr Bountiful, UT 84010
Estimated Value: $477,000 - $589,000
4
Beds
2
Baths
1,676
Sq Ft
$324/Sq Ft
Est. Value
About This Home
This home is located at 1780 Orchard Dr, Bountiful, UT 84010 and is currently estimated at $543,504, approximately $324 per square foot. 1780 Orchard Dr is a home located in Davis County with nearby schools including Bountiful Elementary School, Mueller Park Junior High School, and Bountiful High School.
Ownership History
Date
Name
Owned For
Owner Type
Purchase Details
Closed on
Dec 17, 2012
Sold by
Thorup Robert and Thorup Tracey
Bought by
Thorup Robert D and Thorup Tracey Evans
Current Estimated Value
Purchase Details
Closed on
Jun 29, 2004
Sold by
Thorup Robert D and Thorup Tracey E
Bought by
Thorup Robert D and Thorup Tracey Evans
Create a Home Valuation Report for This Property
The Home Valuation Report is an in-depth analysis detailing your home's value as well as a comparison with similar homes in the area
Purchase History
| Date | Buyer | Sale Price | Title Company |
|---|---|---|---|
| Thorup Robert D | -- | Backman Title Services | |
| Thorup Robert | -- | Backman Title Services Ltd | |
| Thorup Robert D | -- | -- |
Source: Public Records
Tax History
| Year | Tax Paid | Tax Assessment Tax Assessment Total Assessment is a certain percentage of the fair market value that is determined by local assessors to be the total taxable value of land and additions on the property. | Land | Improvement |
|---|---|---|---|---|
| 2025 | $3,249 | $292,050 | $98,693 | $193,357 |
| 2024 | $3,040 | $283,250 | $90,941 | $192,309 |
| 2023 | $2,904 | $491,000 | $205,933 | $285,067 |
| 2022 | $3,085 | $287,100 | $111,598 | $175,502 |
| 2021 | $2,649 | $376,000 | $146,186 | $229,814 |
| 2020 | $2,344 | $333,000 | $123,623 | $209,377 |
| 2019 | $2,383 | $331,000 | $122,344 | $208,656 |
| 2018 | $2,227 | $304,000 | $119,745 | $184,255 |
| 2016 | $1,889 | $139,370 | $52,083 | $87,287 |
| 2015 | $1,850 | $128,810 | $52,083 | $76,727 |
| 2014 | $1,929 | $139,043 | $52,083 | $86,960 |
| 2013 | -- | $114,626 | $44,692 | $69,934 |
Source: Public Records
Map
Nearby Homes
- 141 E 1650 S
- 1654 S 100 E
- 288 E 1650 S
- 1820 S 50 W
- 53 W 1800 S
- 291 E 1950 S
- 188 E 2050 S Unit D3
- 2064 S Orchard Dr
- 438 E 1800 S
- 257 E 2050 S
- 380 E 1500 S
- 2059 S 350 E Unit 6
- 2038 S 350 E Unit 3
- 2046 S 350 E Unit 4
- 1886 S Jeri Dr
- 320 E 2100 S
- 631 E 1700 S
- 1350 S 200 W
- 1950 S 200 W Unit 32
- 1314 S 200 W Unit 19
Your Personal Tour Guide
Ask me questions while you tour the home.