17805 Rudgate St Unit 41 Southgate, MI 48195
Estimated Value: $109,000 - $140,000
--
Bed
1
Bath
912
Sq Ft
$140/Sq Ft
Est. Value
About This Home
This home is located at 17805 Rudgate St Unit 41, Southgate, MI 48195 and is currently estimated at $127,781, approximately $140 per square foot. 17805 Rudgate St Unit 41 is a home located in Wayne County with nearby schools including Shelters Elementary School, Davidson Middle School, and Southgate Anderson High School.
Ownership History
Date
Name
Owned For
Owner Type
Purchase Details
Closed on
Nov 11, 2021
Sold by
Blackson Janet
Bought by
Blackson Janet and Blackson William R
Current Estimated Value
Purchase Details
Closed on
Jun 29, 2007
Sold by
Cicotte Chapa Josann and Kesley Yvonne
Bought by
Blackson Janet
Purchase Details
Closed on
Mar 14, 2007
Sold by
Cicotte Josann
Bought by
Wells Fargo Bank Na and Carrington Mortgage Loan Trust Series 20
Purchase Details
Closed on
Sep 30, 2005
Sold by
Winters Wallace C and Winters Dennis E
Bought by
Cicotte Josann
Purchase Details
Closed on
Nov 15, 1995
Sold by
Wallace C and Wallace Esther E
Bought by
Wallace C and Winters Esther E
Create a Home Valuation Report for This Property
The Home Valuation Report is an in-depth analysis detailing your home's value as well as a comparison with similar homes in the area
Home Values in the Area
Average Home Value in this Area
Purchase History
| Date | Buyer | Sale Price | Title Company |
|---|---|---|---|
| Blackson Janet | -- | None Available | |
| Blackson Janet | $79,000 | Multiple | |
| Wells Fargo Bank Na | $69,319 | None Available | |
| Cicotte Josann | $82,000 | Multiple | |
| Wallace C | $749,000 | -- |
Source: Public Records
Tax History Compared to Growth
Tax History
| Year | Tax Paid | Tax Assessment Tax Assessment Total Assessment is a certain percentage of the fair market value that is determined by local assessors to be the total taxable value of land and additions on the property. | Land | Improvement |
|---|---|---|---|---|
| 2025 | $1,569 | $67,900 | $0 | $0 |
| 2024 | $1,569 | $62,500 | $0 | $0 |
| 2023 | $1,502 | $54,900 | $0 | $0 |
| 2022 | $1,751 | $48,800 | $0 | $0 |
| 2021 | $1,703 | $43,900 | $0 | $0 |
| 2020 | $1,673 | $40,300 | $0 | $0 |
| 2019 | $1,651 | $37,200 | $0 | $0 |
| 2018 | $1,243 | $28,100 | $0 | $0 |
| 2017 | $799 | $28,200 | $0 | $0 |
| 2016 | $1,762 | $35,500 | $0 | $0 |
| 2015 | $3,148 | $33,500 | $0 | $0 |
| 2013 | $3,050 | $31,200 | $0 | $0 |
| 2012 | $1,258 | $30,000 | $5,500 | $24,500 |
Source: Public Records
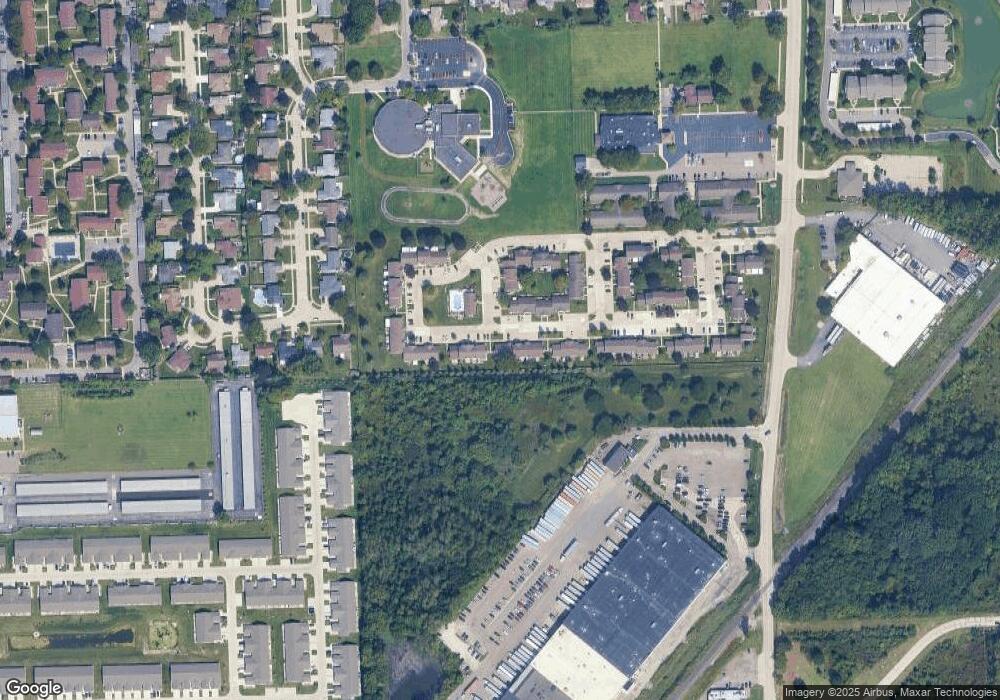
Map
Nearby Homes
- 17405 Raleigh Square Dr Unit 76
- 11348 Afton Rd
- 16185 Goddard Rd
- 0000 Reeck Rd
- 11187 Ziegler St
- 10820 Balfour Ave
- 10854 Allen Rd
- 00 Allen Rd
- 12391 First Ave S
- 15701 Crescent Ave
- 15823 Rose Dr
- 15941 Promenade Ave
- 10065 Northway Ave
- 10109 Allen Pointe Dr Unit 129
- 15210 Heatherwood
- 12420 Churchill Ave
- 12450 Churchill Ave
- 15455 Wesley St
- 12480 Churchill Ave
- 15405 Wesley St
- 17845 Rudgate St
- 17845 Rudgate St Unit 42
- 17885 Rudgate St
- 17765 Rudgate St Unit 40
- 17925 Rudgate St
- 17725 Rudgate St
- 17965 Rudgate St
- 17685 Rudgate St
- 17645 Rudgate St
- 17605 Rudgate St Unit 36
- 17565 Rudgate St
- 18165 Rudgate St Unit 47
- 16505 Hamilton St Unit 87
- 17700 Rudgate St Unit 86
- 18205 Rudgate St
- 17560 Rudgate St
- 18125 Rudgate St Unit 46
- 18245 Rudgate St Unit 49
- 16325 Hamilton St
- 17500 Rudgate St