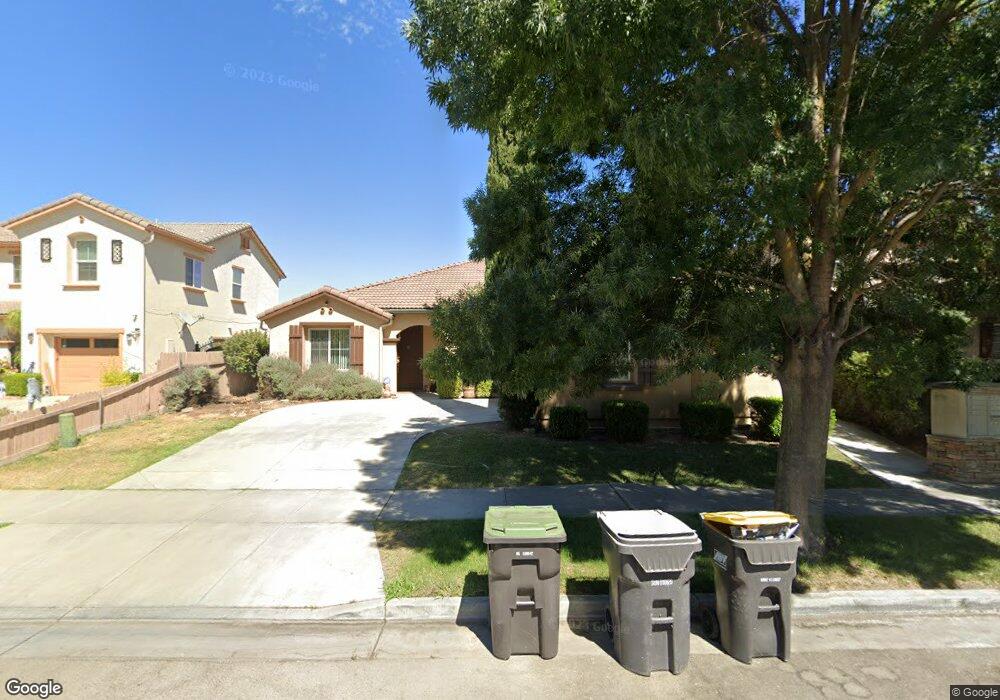
17806 Almond Orchard Way Lathrop, CA 95330
Estimated Value: $544,000 - $634,000
3
Beds
2
Baths
2,256
Sq Ft
$267/Sq Ft
Est. Value
About This Home
This home is located at 17806 Almond Orchard Way, Lathrop, CA 95330 and is currently estimated at $602,998, approximately $267 per square foot. 17806 Almond Orchard Way is a home located in San Joaquin County with nearby schools including Mossdale Elementary School, Lathrop High School, and River Island School of Technology.
Ownership History
Date
Name
Owned For
Owner Type
Purchase Details
Closed on
Mar 3, 2016
Sold by
Kaura Raman D and Sood Nitika
Bought by
The Kaura Family Revocable Trust and Sood Nitika
Current Estimated Value
Purchase Details
Closed on
Sep 18, 2009
Sold by
Bernardo Araceli and Bernardo Jose
Bought by
Kaura Raman D and Sood Nitika
Home Financials for this Owner
Home Financials are based on the most recent Mortgage that was taken out on this home.
Original Mortgage
$127,500
Outstanding Balance
$82,661
Interest Rate
5.02%
Mortgage Type
New Conventional
Estimated Equity
$520,337
Purchase Details
Closed on
Feb 28, 2005
Sold by
Kb Home North Bay Inc
Bought by
Bernardo Jose and Bernardo Araceli
Home Financials for this Owner
Home Financials are based on the most recent Mortgage that was taken out on this home.
Original Mortgage
$331,219
Interest Rate
4.87%
Mortgage Type
Purchase Money Mortgage
Create a Home Valuation Report for This Property
The Home Valuation Report is an in-depth analysis detailing your home's value as well as a comparison with similar homes in the area
Home Values in the Area
Average Home Value in this Area
Purchase History
| Date | Buyer | Sale Price | Title Company |
|---|---|---|---|
| The Kaura Family Revocable Trust | -- | None Available | |
| Kaura Raman D | $170,000 | Fidelity Title Company | |
| Bernardo Jose | $414,500 | First Amer Title Co |
Source: Public Records
Mortgage History
| Date | Status | Borrower | Loan Amount |
|---|---|---|---|
| Open | Kaura Raman D | $127,500 | |
| Previous Owner | Bernardo Jose | $331,219 | |
| Closed | Bernardo Jose | $41,403 |
Source: Public Records
Tax History Compared to Growth
Tax History
| Year | Tax Paid | Tax Assessment Tax Assessment Total Assessment is a certain percentage of the fair market value that is determined by local assessors to be the total taxable value of land and additions on the property. | Land | Improvement |
|---|---|---|---|---|
| 2025 | $5,316 | $219,425 | $54,208 | $165,217 |
| 2024 | $5,198 | $215,124 | $53,146 | $161,978 |
| 2023 | $5,031 | $210,906 | $52,104 | $158,802 |
| 2022 | $5,094 | $206,772 | $51,083 | $155,689 |
| 2021 | $4,980 | $202,719 | $50,082 | $152,637 |
| 2020 | $4,868 | $200,641 | $49,569 | $151,072 |
| 2019 | $4,804 | $196,708 | $48,598 | $148,110 |
| 2018 | $4,734 | $192,852 | $47,646 | $145,206 |
| 2017 | $4,665 | $189,071 | $46,712 | $142,359 |
| 2016 | $4,586 | $185,365 | $45,796 | $139,569 |
| 2015 | $4,570 | $182,581 | $45,108 | $137,473 |
| 2014 | $4,416 | $179,006 | $44,225 | $134,781 |
Source: Public Records
Map
Nearby Homes
- 577 Brookhurst Blvd
- 17753 Wheat Field St
- 17975 Rusty Plow Ln
- 582 Pasture Ave
- 17709 Mckee Blvd
- 17806 Mckee Blvd
- 17898 Mckee Blvd
- 17942 Mckee Blvd
- 17879 Farm House Rd
- 274 Apple Grove Ave
- 17840 Farm House Rd
- Macon II Plan at Mariposa
- Aegean Plan at Mariposa
- 17862 Farm House Rd
- 250 Apple Grove Ave
- 17350 Mill Stone Way
- 17351 Pheasant Downs Rd
- 323 Autumn Rain Dr
- 17360 Ferndale St
- 18447 Orilla St
- 17828 Almond Orchard Way
- 17784 Almond Orchard Way
- 17791 Golden Spike Trail
- 17811 Golden Spike Trail
- 17760 Almond Orchard Way
- 17842 Almond Orchard Way
- 17769 Golden Spike Trail
- 17825 Golden Spike Trail
- 581 Cold Springs St
- 17755 Golden Spike Trail
- 17791 Almond Orchard Way
- 17841 Golden Spike Trail
- 17813 Almond Orchard Way
- 17775 Almond Orchard Way
- 551 Cold Springs St
- 17738 Almond Orchard Way
- 17737 Golden Spike Trail
- 17753 Almond Orchard Way
- 569 Cold Springs St
- 17716 Almond Orchard Way