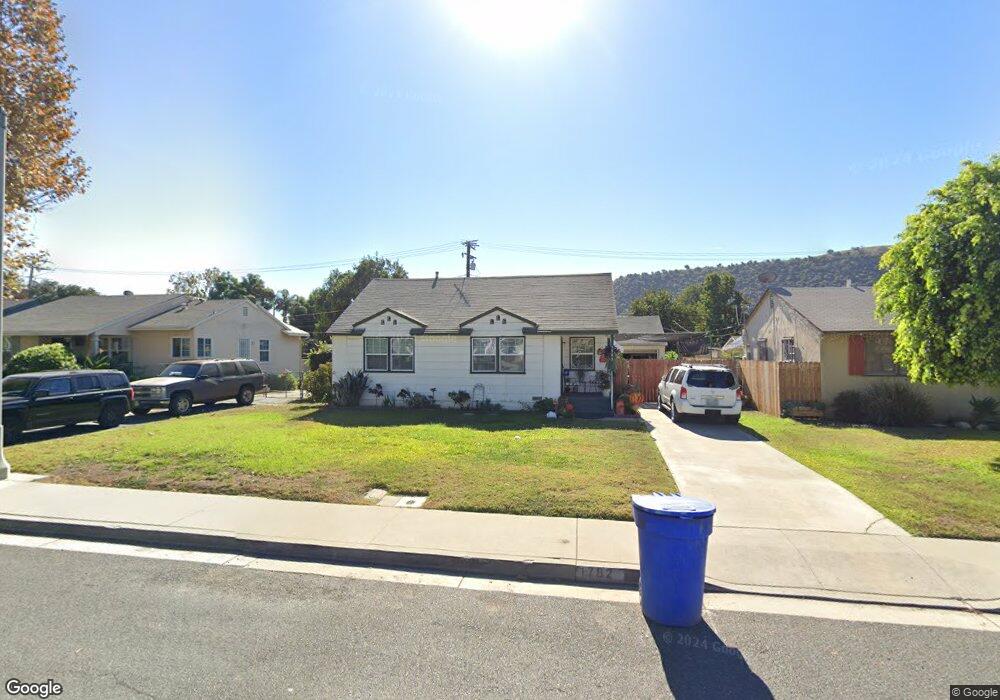
1782 Fleming St Pomona, CA 91766
Phillips Ranch NeighborhoodEstimated Value: $607,000 - $631,310
2
Beds
1
Bath
808
Sq Ft
$759/Sq Ft
Est. Value
About This Home
This home is located at 1782 Fleming St, Pomona, CA 91766 and is currently estimated at $613,578, approximately $759 per square foot. 1782 Fleming St is a home located in Los Angeles County with nearby schools including Westmont Elementary, Fremont Academy of Engineering and Design, and Ganesha High School.
Ownership History
Date
Name
Owned For
Owner Type
Purchase Details
Closed on
Jun 29, 2004
Sold by
Losoya Becky and Malooly Richard G
Bought by
Losoya Becky
Current Estimated Value
Home Financials for this Owner
Home Financials are based on the most recent Mortgage that was taken out on this home.
Original Mortgage
$140,500
Outstanding Balance
$68,021
Interest Rate
5.75%
Mortgage Type
Purchase Money Mortgage
Estimated Equity
$545,557
Purchase Details
Closed on
Aug 6, 2003
Sold by
Kramer Grace A
Bought by
Losoya Becky
Purchase Details
Closed on
Aug 6, 2002
Sold by
Isaacson Margie
Bought by
Kramer Grace A
Home Financials for this Owner
Home Financials are based on the most recent Mortgage that was taken out on this home.
Original Mortgage
$137,750
Interest Rate
6.24%
Mortgage Type
Balloon
Create a Home Valuation Report for This Property
The Home Valuation Report is an in-depth analysis detailing your home's value as well as a comparison with similar homes in the area
Home Values in the Area
Average Home Value in this Area
Purchase History
| Date | Buyer | Sale Price | Title Company |
|---|---|---|---|
| Losoya Becky | -- | Southland Title Corporation | |
| Losoya Becky | -- | Southland Title Corporation | |
| Kramer Grace A | $145,000 | Chicago Title |
Source: Public Records
Mortgage History
| Date | Status | Borrower | Loan Amount |
|---|---|---|---|
| Open | Losoya Becky | $140,500 | |
| Previous Owner | Kramer Grace A | $137,750 |
Source: Public Records
Tax History
| Year | Tax Paid | Tax Assessment Tax Assessment Total Assessment is a certain percentage of the fair market value that is determined by local assessors to be the total taxable value of land and additions on the property. | Land | Improvement |
|---|---|---|---|---|
| 2025 | $3,988 | $309,428 | $250,896 | $58,532 |
| 2024 | $3,988 | $303,362 | $245,977 | $57,385 |
| 2023 | $3,908 | $297,414 | $241,154 | $56,260 |
| 2022 | $3,846 | $291,583 | $236,426 | $55,157 |
| 2021 | $3,759 | $285,867 | $231,791 | $54,076 |
| 2019 | $3,840 | $277,390 | $224,917 | $52,473 |
| 2018 | $3,554 | $271,952 | $220,507 | $51,445 |
| 2016 | $3,341 | $261,395 | $211,946 | $49,449 |
| 2015 | $3,312 | $257,470 | $208,763 | $48,707 |
| 2014 | $3,292 | $252,427 | $204,674 | $47,753 |
Source: Public Records
Map
Nearby Homes
- 1803 Fleming St
- 1815 W 9th St
- 1683 Meserve St
- 1693 Jess St
- 1638 Vejar St
- 1401 W 9th St Unit 61
- 1401 W 9th St Unit 59
- 1493 W Grand Ave
- 264 Oak Ave
- 1476 W Holt Ave
- 1300 W Mission Blvd
- 309 Via Moreno
- 1574 Laurel Ave
- 1947 Arthur Ave
- 1208 W 11th St
- 23 Calle Del Cabos
- 1337 Clovis Ct
- 1443 Laurel Ave
- 3 Wild West Cir
- 1301 Fremont St
- 1790 Fleming St
- 1770 Fleming St
- 1798 Fleming St
- 1783 Denison St
- 1791 Denison St
- 1779 Denison St
- 1764 Fleming St
- 1797 Denison St
- 1773 Denison St
- 1781 Fleming St
- 1789 Fleming St
- 1773 Fleming St
- 1795 Fleming St
- 1765 Denison St
- 1758 Fleming St
- 1804 Fleming St
- 1765 Fleming St
- 1803 Denison St
- 1759 Denison St
- 1757 Fleming St
Your Personal Tour Guide
Ask me questions while you tour the home.