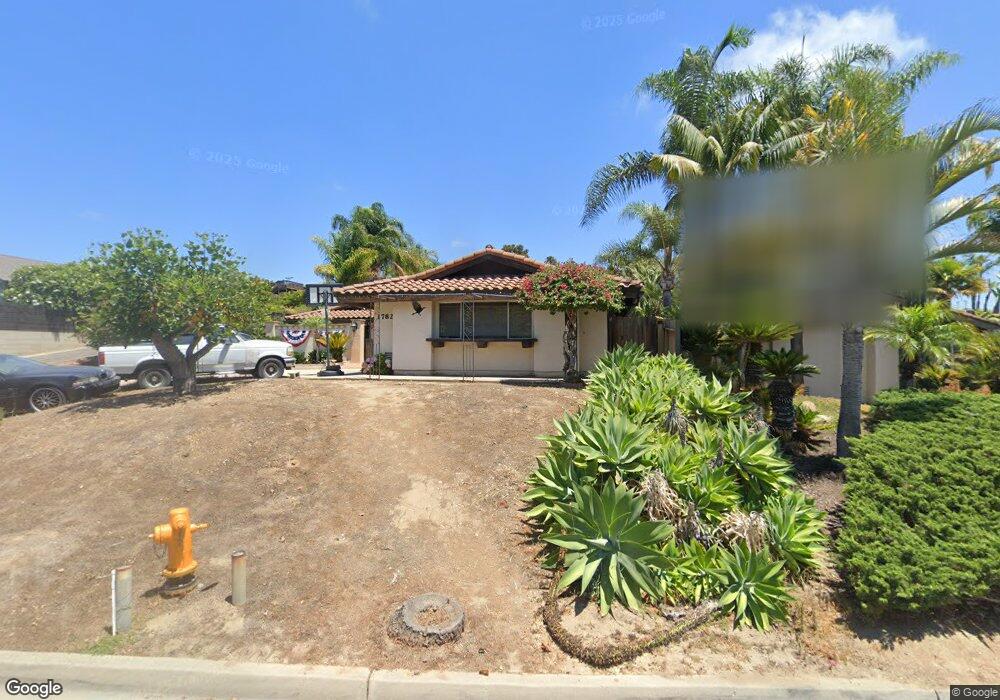
1782 Ivy Rd Oceanside, CA 92054
Fire Mountain NeighborhoodEstimated Value: $1,445,544 - $1,553,000
4
Beds
2
Baths
2,161
Sq Ft
$698/Sq Ft
Est. Value
About This Home
This home is located at 1782 Ivy Rd, Oceanside, CA 92054 and is currently estimated at $1,508,886, approximately $698 per square foot. 1782 Ivy Rd is a home located in San Diego County with nearby schools including Palmquist Elementary School, Lincoln Middle School, and Oceanside High School.
Ownership History
Date
Name
Owned For
Owner Type
Purchase Details
Closed on
Oct 30, 2020
Sold by
Allison Derek P and Allison Marilyn L
Bought by
Allison Derek P and Allison Marilyn L
Current Estimated Value
Purchase Details
Closed on
Aug 12, 2020
Sold by
Allison Derek P and Allison Merlyn L
Bought by
Allison Derek P and Allison Marilyn L
Home Financials for this Owner
Home Financials are based on the most recent Mortgage that was taken out on this home.
Original Mortgage
$182,100
Outstanding Balance
$145,598
Interest Rate
3%
Mortgage Type
New Conventional
Estimated Equity
$1,363,288
Purchase Details
Closed on
Mar 6, 2006
Sold by
Allison Derek P and Allison Marilyn Lewis
Bought by
Allison Derek P and Allison Marilyn L
Purchase Details
Closed on
Aug 17, 1998
Sold by
Giuliano Rose Family Trust 07-15-91 and Giuliano Joseph
Bought by
Allison Derek P and Allison Marilyn Lewes
Home Financials for this Owner
Home Financials are based on the most recent Mortgage that was taken out on this home.
Original Mortgage
$180,000
Interest Rate
6.58%
Mortgage Type
Balloon
Create a Home Valuation Report for This Property
The Home Valuation Report is an in-depth analysis detailing your home's value as well as a comparison with similar homes in the area
Home Values in the Area
Average Home Value in this Area
Purchase History
| Date | Buyer | Sale Price | Title Company |
|---|---|---|---|
| Allison Derek P | -- | None Available | |
| Allison Derek P | -- | Fidelity National Title Co | |
| Allison Derek P | -- | None Available | |
| Allison Derek P | $240,000 | First American Title |
Source: Public Records
Mortgage History
| Date | Status | Borrower | Loan Amount |
|---|---|---|---|
| Open | Allison Derek P | $182,100 | |
| Closed | Allison Derek P | $180,000 |
Source: Public Records
Tax History
| Year | Tax Paid | Tax Assessment Tax Assessment Total Assessment is a certain percentage of the fair market value that is determined by local assessors to be the total taxable value of land and additions on the property. | Land | Improvement |
|---|---|---|---|---|
| 2025 | $4,097 | $376,226 | $141,082 | $235,144 |
| 2024 | $4,097 | $368,850 | $138,316 | $230,534 |
| 2023 | $3,969 | $361,618 | $135,604 | $226,014 |
| 2022 | $3,908 | $354,529 | $132,946 | $221,583 |
| 2021 | $3,922 | $347,579 | $130,340 | $217,239 |
| 2020 | $3,800 | $344,016 | $129,004 | $215,012 |
| 2019 | $3,689 | $337,272 | $126,475 | $210,797 |
| 2018 | $3,649 | $330,660 | $123,996 | $206,664 |
| 2017 | $3,580 | $324,177 | $121,565 | $202,612 |
| 2016 | $3,463 | $317,822 | $119,182 | $198,640 |
| 2015 | $3,361 | $313,049 | $117,392 | $195,657 |
| 2014 | $3,231 | $306,918 | $115,093 | $191,825 |
Source: Public Records
Map
Nearby Homes
- 1773 Ivy Rd
- 1782 Troy Ln
- 1760 Woodbine Place
- 1738 Kurtz St
- 2241 California St
- 2245 Ivy Rd
- 2275 Ivy Rd
- 1541 Lauralynn Place
- 1714 Hicks St
- 1519 Kurtz St
- 1609 Lopez St
- 2309 Loker Way
- Signal Point 1 Plan at Signal Point
- Signal Point 2 Plan at Signal Point
- 1405 Pambara Cir
- 1427 Avocado Rd
- 2399 Ivy Rd
- 2306 Loker Way
- 2308 Loker Way
- 2312 Loker Way