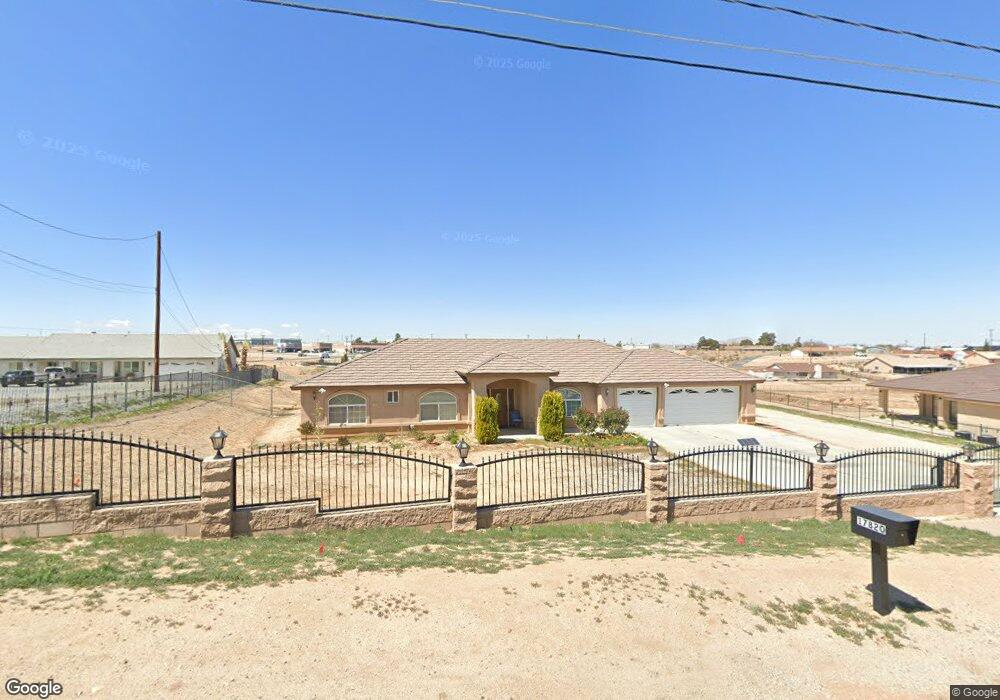
17820 Talisman St Hesperia, CA 92345
Estimated Value: $505,232 - $722,000
4
Beds
3
Baths
2,332
Sq Ft
$258/Sq Ft
Est. Value
About This Home
This home is located at 17820 Talisman St, Hesperia, CA 92345 and is currently estimated at $600,558, approximately $257 per square foot. 17820 Talisman St is a home located in San Bernardino County with nearby schools including Juniper Elementary School, Ranchero Middle School, and Sultana High School.
Ownership History
Date
Name
Owned For
Owner Type
Purchase Details
Closed on
Jun 15, 2020
Sold by
Carlson James R and Carlson Hui Sun
Bought by
Carlson James R and Carlson Hui Sun
Current Estimated Value
Purchase Details
Closed on
Nov 18, 2010
Sold by
Aleman Sergio Rodarte
Bought by
Carlson James R and Carlson Hui Sun
Purchase Details
Closed on
May 7, 2008
Sold by
Market Capital Inc
Bought by
Aleman Sergio Rodarte and Aleman Lydia
Home Financials for this Owner
Home Financials are based on the most recent Mortgage that was taken out on this home.
Original Mortgage
$289,750
Interest Rate
5.88%
Mortgage Type
Purchase Money Mortgage
Purchase Details
Closed on
Mar 3, 2008
Sold by
Fruciano Michael J
Bought by
Market Capital Inc
Purchase Details
Closed on
Feb 27, 2008
Sold by
Luna Michael and Luna Dominic M
Bought by
Fruciano Michael
Create a Home Valuation Report for This Property
The Home Valuation Report is an in-depth analysis detailing your home's value as well as a comparison with similar homes in the area
Purchase History
| Date | Buyer | Sale Price | Title Company |
|---|---|---|---|
| Carlson James R | -- | None Available | |
| Carlson James R | -- | None Available | |
| Carlson James R | $180,000 | Fidelity National Title | |
| Aleman Sergio Rodarte | $300,000 | Chicago Title Company | |
| Market Capital Inc | -- | Chicago Title Company | |
| Fruciano Michael J | -- | Chicago Title Company | |
| Fruciano Michael | $298,165 | None Available |
Source: Public Records
Mortgage History
| Date | Status | Borrower | Loan Amount |
|---|---|---|---|
| Previous Owner | Aleman Sergio Rodarte | $289,750 |
Source: Public Records
Tax History
| Year | Tax Paid | Tax Assessment Tax Assessment Total Assessment is a certain percentage of the fair market value that is determined by local assessors to be the total taxable value of land and additions on the property. | Land | Improvement |
|---|---|---|---|---|
| 2025 | $2,700 | $239,265 | $57,653 | $181,612 |
| 2024 | $2,639 | $234,574 | $56,523 | $178,051 |
| 2023 | $2,610 | $229,975 | $55,415 | $174,560 |
| 2022 | $2,551 | $225,465 | $54,328 | $171,137 |
| 2021 | $2,504 | $221,044 | $53,263 | $167,781 |
| 2020 | $2,475 | $218,779 | $52,718 | $166,061 |
| 2019 | $2,424 | $214,489 | $51,684 | $162,805 |
| 2018 | $2,378 | $210,284 | $50,671 | $159,613 |
| 2017 | $2,336 | $206,160 | $49,677 | $156,483 |
| 2016 | $2,287 | $202,118 | $48,703 | $153,415 |
| 2015 | $2,258 | $199,082 | $47,971 | $151,111 |
| 2014 | $2,151 | $188,123 | $47,031 | $141,092 |
Source: Public Records
Map
Nearby Homes
- 17840 Talisman St
- 10903 E Ave
- 10793 G Ave
- 0 Lemon St Unit OC24074806
- 0 Lemon Ave Unit PW25236291
- 0 Lemon St Unit HD25078627
- 17620 Lemon St
- 0 Talisman St Unit CV25271490
- 10872 Peach Ave
- 18292 Verano St
- 0 Valencia St Unit HD26021487
- 0 Jacaranda Unit CV24240940
- 18441 Verano St
- 0 Darwin Ave Unit HD25264451
- 0 Fresno St Unit IV26006403
- 0 Fresno St Unit HD25113434
- 0 Fresno St Unit IV24217639
- 18062 Hackberry St
- 0 Catalpa Unit HD25253555
- 18063 Catalpa St
- 17798 Talisman St
- 17818 Talisman St
- 17817 Talisman St
- 17814 Talisman St
- 17851 Talisman St
- 17860 Talisman St
- 17806 Talisman St
- 17876 Talisman St
- 10809 I Ave
- 17796 Valencia St
- 10777 I Ave Unit 7-Th
- 10769 I Ave
- 17832 Valencia St
- 10907 E Ave
- 17869 Talisman St
- 17783 Talisman St
- 10901 E Ave
- 10909 E Ave
- 17854 Valencia St
- 10913 E Ave
Your Personal Tour Guide
Ask me questions while you tour the home.