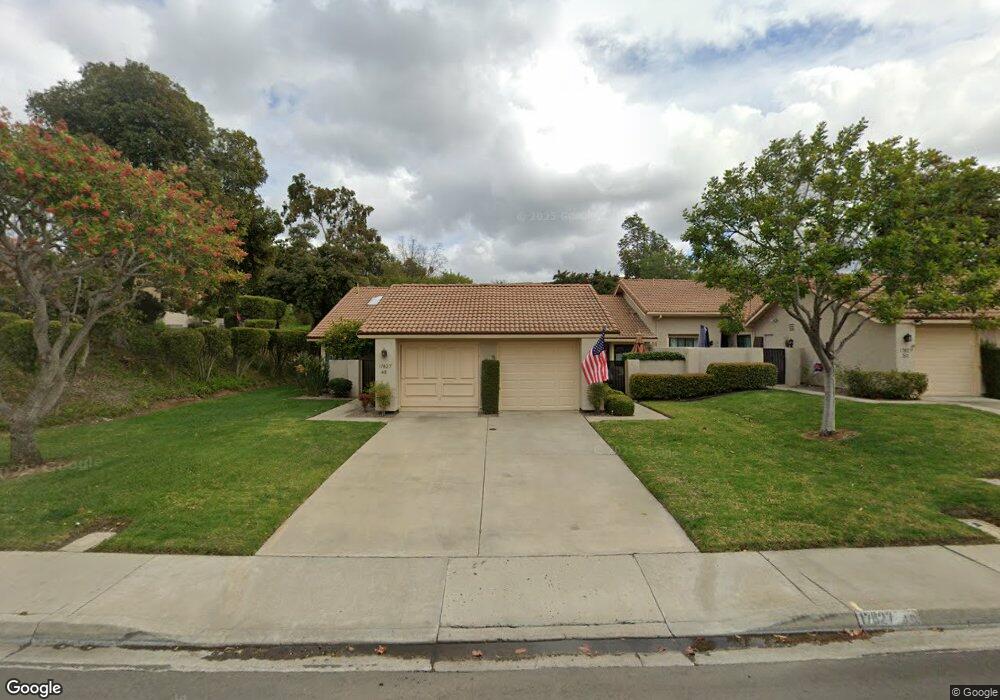
17827 Avenida Cordillera Unit 49 San Diego, CA 92128
Rancho Bernardo NeighborhoodEstimated Value: $623,972 - $743,000
2
Beds
2
Baths
1,040
Sq Ft
$666/Sq Ft
Est. Value
About This Home
This home is located at 17827 Avenida Cordillera Unit 49, San Diego, CA 92128 and is currently estimated at $692,493, approximately $665 per square foot. 17827 Avenida Cordillera Unit 49 is a home located in San Diego County with nearby schools including Chaparral Elementary, Bernardo Heights Middle, and Rancho Bernardo High.
Ownership History
Date
Name
Owned For
Owner Type
Purchase Details
Closed on
Jul 16, 2020
Sold by
Auletta Dorothy B
Bought by
Auletta Dorothy B
Current Estimated Value
Home Financials for this Owner
Home Financials are based on the most recent Mortgage that was taken out on this home.
Original Mortgage
$712,500
Outstanding Balance
$628,816
Interest Rate
2.85%
Mortgage Type
Reverse Mortgage Home Equity Conversion Mortgage
Estimated Equity
$63,677
Purchase Details
Closed on
Feb 27, 2018
Sold by
Runkle Richard L
Bought by
Auletta Dorothy B
Home Financials for this Owner
Home Financials are based on the most recent Mortgage that was taken out on this home.
Original Mortgage
$657,900
Interest Rate
4.62%
Mortgage Type
Reverse Mortgage Home Equity Conversion Mortgage
Purchase Details
Closed on
Dec 19, 2006
Sold by
Runkle Family Lp
Bought by
Runkle Richard L
Purchase Details
Closed on
Aug 8, 2002
Sold by
Runkle Karl E and Runkle Ethel B
Bought by
Runkle Family Lp
Create a Home Valuation Report for This Property
The Home Valuation Report is an in-depth analysis detailing your home's value as well as a comparison with similar homes in the area
Home Values in the Area
Average Home Value in this Area
Purchase History
| Date | Buyer | Sale Price | Title Company |
|---|---|---|---|
| Auletta Dorothy B | -- | Ticor Title Company | |
| Auletta Dorothy B | $439,000 | Corinthian Title Company | |
| Runkle Richard L | $173,000 | None Available | |
| Runkle Family Lp | -- | -- |
Source: Public Records
Mortgage History
| Date | Status | Borrower | Loan Amount |
|---|---|---|---|
| Open | Auletta Dorothy B | $712,500 | |
| Closed | Auletta Dorothy B | $657,900 |
Source: Public Records
Tax History Compared to Growth
Tax History
| Year | Tax Paid | Tax Assessment Tax Assessment Total Assessment is a certain percentage of the fair market value that is determined by local assessors to be the total taxable value of land and additions on the property. | Land | Improvement |
|---|---|---|---|---|
| 2025 | $5,475 | $499,047 | $306,769 | $192,278 |
| 2024 | $5,475 | $489,262 | $300,754 | $188,508 |
| 2023 | $5,358 | $479,669 | $294,857 | $184,812 |
| 2022 | $5,267 | $470,265 | $289,076 | $181,189 |
| 2021 | $5,197 | $461,045 | $283,408 | $177,637 |
| 2020 | $5,127 | $456,318 | $280,502 | $175,816 |
| 2019 | $4,993 | $447,371 | $275,002 | $172,369 |
| 2018 | $3,831 | $340,000 | $209,000 | $131,000 |
| 2017 | $3,803 | $340,000 | $209,000 | $131,000 |
| 2016 | $3,412 | $305,000 | $188,000 | $117,000 |
| 2015 | $3,357 | $300,000 | $185,000 | $115,000 |
| 2014 | $3,014 | $270,000 | $167,000 | $103,000 |
Source: Public Records
Map
Nearby Homes
- 17842 Avenida Cordillera Unit 30
- 12732 Camino de la Breccia Unit 9
- 12977 Camino Emparrado
- 12870 Camino de la Breccia
- 18035 Avenida Alozdra Unit 298
- 12865 Camino de la Breccia Unit 109
- 17762 Plaza Acosta
- 17738 Plaza Acosta
- 12880 Circulo Dardo
- 12725 Via Nasca
- 17676 Corte Sobrado
- 17909 Avenida Alozdra
- 18018 Calle Estepona
- 17780 Cumana Terrace
- 12516 Camino Vuelo
- 12982 Polvera Ct
- 18787 Aceituno St
- 13356 Corte de Chucena
- 13025 Avenida Marbella
- 18818 Bernardo Trails Dr Unit 6
- 17827 Avenida Cordillera Unit 49
- 17827 Avenida Cordillera Unit 50
- 17827 Avenida Cordillera Unit 48
- 17827 Avenida Cordillera Unit 51
- 17827 Avenida Cordillera Unit 50
- 17827 Avenida Cordillera Unit 48
- 17822 Avenida Cordillera Unit 20
- 17822 Avenida Cordillera Unit 22
- 17822 Avenida Cordillera Unit 23
- 17822 Avenida Cordillera Unit 22
- 17822 Avenida Cordillera Unit 21
- 17822 Avenida Cordillera Unit 20
- 17857 Avenida Cordillera Unit 46
- 17857 Avenida Cordillera Unit 45
- 17857 Avenida Cordillera Unit 44
- 17857 Avenida Cordillera Unit 47
- 17857 Avenida Cordillera Unit 46
- 17857 Avenida Cordillera Unit 45
- 17857 Avenida Cordillera Unit 44
- 17804 Corte Huasco Unit 58