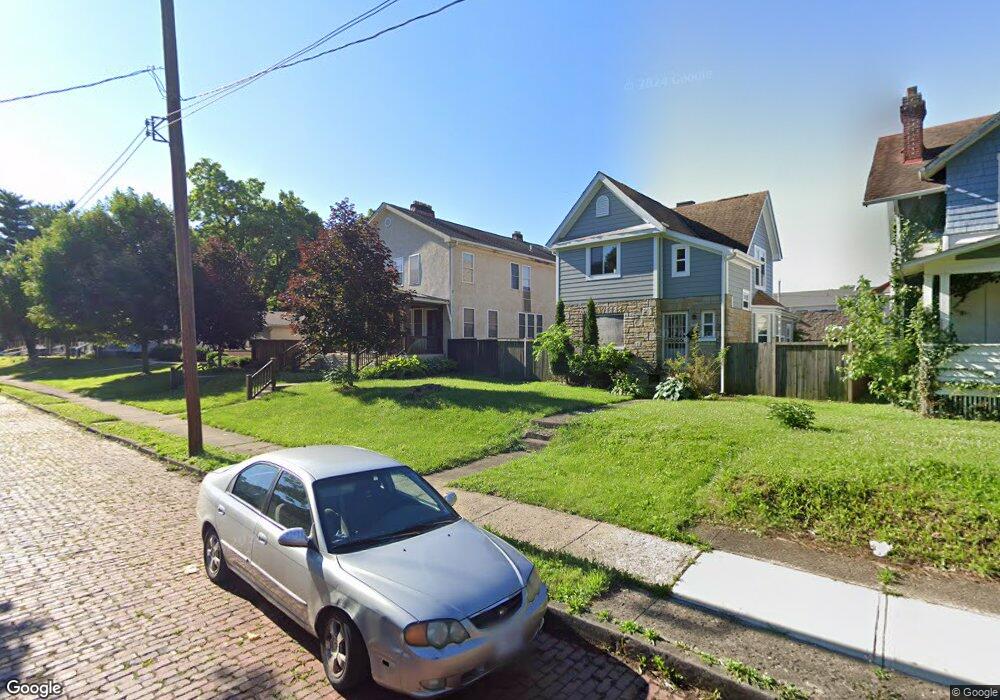
1783 E Rich St Unit 785 Columbus, OH 43205
Franklin Park NeighborhoodEstimated Value: $386,239 - $513,000
6
Beds
4
Baths
3,072
Sq Ft
$146/Sq Ft
Est. Value
About This Home
This home is located at 1783 E Rich St Unit 785, Columbus, OH 43205 and is currently estimated at $449,310, approximately $146 per square foot. 1783 E Rich St Unit 785 is a home located in Franklin County with nearby schools including Ohio Avenue Elementary School, Champion Middle School, and East High School.
Ownership History
Date
Name
Owned For
Owner Type
Purchase Details
Closed on
Dec 30, 2013
Sold by
Uy Soth and Ayala Omar
Bought by
Ayala Properties Llc
Current Estimated Value
Purchase Details
Closed on
Apr 28, 2003
Sold by
U S Bank Na
Bought by
Ayala Omar A
Purchase Details
Closed on
Oct 31, 2002
Sold by
Sackett Todd
Bought by
U S Bank Na and Eqcc Home Equity Loan Trust 1999-2
Purchase Details
Closed on
Mar 9, 1999
Sold by
Munce Pamela K and Munce David H
Bought by
Sackett Todd A
Home Financials for this Owner
Home Financials are based on the most recent Mortgage that was taken out on this home.
Original Mortgage
$56,000
Interest Rate
6.78%
Purchase Details
Closed on
Feb 18, 1994
Bought by
Munce Pamela K and Munce David H
Purchase Details
Closed on
Mar 28, 1991
Create a Home Valuation Report for This Property
The Home Valuation Report is an in-depth analysis detailing your home's value as well as a comparison with similar homes in the area
Home Values in the Area
Average Home Value in this Area
Purchase History
| Date | Buyer | Sale Price | Title Company |
|---|---|---|---|
| Ayala Properties Llc | -- | None Available | |
| Ayala Omar A | $45,000 | Accutitle Agency Inc | |
| U S Bank Na | $34,600 | Accutitle Agency Inc | |
| Sackett Todd A | $56,000 | -- | |
| Munce Pamela K | $13,000 | -- | |
| -- | $3,000 | -- |
Source: Public Records
Mortgage History
| Date | Status | Borrower | Loan Amount |
|---|---|---|---|
| Previous Owner | Sackett Todd A | $56,000 |
Source: Public Records
Tax History
| Year | Tax Paid | Tax Assessment Tax Assessment Total Assessment is a certain percentage of the fair market value that is determined by local assessors to be the total taxable value of land and additions on the property. | Land | Improvement |
|---|---|---|---|---|
| 2025 | $5,907 | $87,190 | $27,720 | $59,470 |
| 2024 | $5,907 | $87,190 | $27,720 | $59,470 |
| 2023 | $3,904 | $87,185 | $27,720 | $59,465 |
| 2022 | $5,161 | $45,050 | $2,380 | $42,670 |
| 2021 | $2,693 | $45,050 | $2,380 | $42,670 |
| 2020 | $2,523 | $45,050 | $2,380 | $42,670 |
| 2019 | $2,632 | $37,530 | $2,000 | $35,530 |
| 2018 | $2,473 | $37,530 | $2,000 | $35,530 |
| 2017 | $2,354 | $37,530 | $2,000 | $35,530 |
| 2016 | $2,745 | $40,920 | $3,920 | $37,000 |
| 2015 | $2,496 | $40,920 | $3,920 | $37,000 |
| 2014 | $2,502 | $40,920 | $3,920 | $37,000 |
| 2013 | $1,299 | $43,085 | $4,130 | $38,955 |
Source: Public Records
Map
Nearby Homes
- 1779 E Main St
- 1707 E Main St Unit 1705
- 423 Stoddart Ave
- 422-424 Morrison Ave
- 409-411 Morrison Ave
- 572 Bulen Ave
- 389-391 Berkeley Rd
- 377 Berkeley Rd
- 1847 Oak St
- 592 Rhoads Ave Unit 594
- 1714 Oak St
- 1614 E Fulton St
- 1555 E Rich St Unit 557
- 547 Berkeley Rd
- 489 Lilley Ave
- 623 Seymour Ave
- 604 Berkeley Rd
- 1571 Franklin Ave
- 518 Kelton Ave Unit 45
- 522 Kelton Ave
- 1783-1785 E Rich St
- 1781 E Rich St
- 1773 E Rich St
- 1779 E Rich St Unit 781
- 1801 E Rich St
- 1761 E Cherry St
- 1807 E Rich St
- 1784 E Rich St
- 424 Fairwood Ave
- 434 Fairwood Ave
- 418 Fairwood Ave
- 1794 E Rich St
- 1809 E Rich St
- 1809 E Rich St Unit 11
- 1800 E Rich St
- 1811 E Rich St
- 1811 E Rich St Unit 1811 1/2
- 1811 E Rich St Unit 11.5
- 1772 E Main St Unit 774
- 1804 E Rich St
Your Personal Tour Guide
Ask me questions while you tour the home.