Estimated Value: $505,000 - $604,000
4
Beds
3
Baths
3,392
Sq Ft
$161/Sq Ft
Est. Value
About This Home
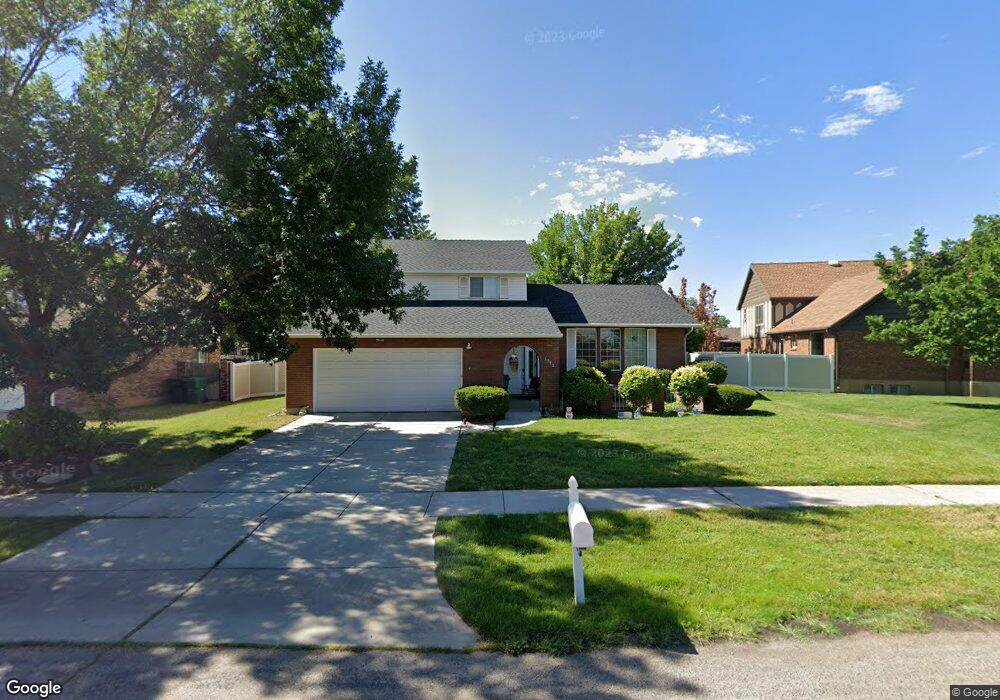
This home is located at 1783 W 4425 S, Roy, UT 84067 and is currently estimated at $546,328, approximately $161 per square foot. 1783 W 4425 S is a home located in Weber County with nearby schools including North Park School, Sand Ridge Junior High School, and Roy High School.
Ownership History
Date
Name
Owned For
Owner Type
Purchase Details
Closed on
Mar 1, 2018
Sold by
Heslop Terry L and Heslop Linda Rae
Bought by
Taylor Deon and Taylor Jill
Current Estimated Value
Home Financials for this Owner
Home Financials are based on the most recent Mortgage that was taken out on this home.
Original Mortgage
$283,766
Outstanding Balance
$242,236
Interest Rate
4.22%
Mortgage Type
FHA
Estimated Equity
$304,092
Purchase Details
Closed on
Nov 28, 2017
Sold by
Nilson & Company Inc
Bought by
Heslop Terry L and Heslop Linda R
Home Financials for this Owner
Home Financials are based on the most recent Mortgage that was taken out on this home.
Original Mortgage
$263,280
Interest Rate
3.88%
Mortgage Type
Construction
Create a Home Valuation Report for This Property
The Home Valuation Report is an in-depth analysis detailing your home's value as well as a comparison with similar homes in the area
Home Values in the Area
Average Home Value in this Area
Purchase History
| Date | Buyer | Sale Price | Title Company |
|---|---|---|---|
| Taylor Deon | -- | Stewart Title Agency | |
| Heslop Terry L | -- | Stewart Title Ins Agency Of |
Source: Public Records
Mortgage History
| Date | Status | Borrower | Loan Amount |
|---|---|---|---|
| Open | Taylor Deon | $283,766 | |
| Previous Owner | Heslop Terry L | $263,280 |
Source: Public Records
Tax History Compared to Growth
Tax History
| Year | Tax Paid | Tax Assessment Tax Assessment Total Assessment is a certain percentage of the fair market value that is determined by local assessors to be the total taxable value of land and additions on the property. | Land | Improvement |
|---|---|---|---|---|
| 2025 | $3,039 | $489,312 | $147,947 | $341,365 |
| 2024 | $2,966 | $264,549 | $81,378 | $183,171 |
| 2023 | $2,829 | $252,450 | $79,472 | $172,978 |
| 2022 | $2,705 | $246,950 | $63,666 | $183,284 |
| 2021 | $2,385 | $360,000 | $81,879 | $278,121 |
| 2020 | $2,211 | $306,000 | $81,879 | $224,121 |
| 2019 | $2,211 | $289,000 | $47,433 | $241,567 |
| 2018 | $2,106 | $259,000 | $42,600 | $216,400 |
| 2017 | $1,981 | $228,000 | $42,600 | $185,400 |
| 2016 | $1,984 | $123,365 | $23,759 | $99,606 |
| 2015 | $1,928 | $123,365 | $21,102 | $102,263 |
| 2014 | $1,857 | $117,051 | $21,102 | $95,949 |
Source: Public Records
Map
Nearby Homes
- 1825 W 4400 S
- 4438 S 1700 W
- 4501 S 1720 W
- 1681 W 4450 S
- 4502 S 1720 W
- 1825 W 4500 S Unit 101
- 1766 W 4575 S
- 4536 S 1900 W Unit 12
- 4552 S 1675 W
- 4642 S 1900 W Unit 41
- 4593 Promenade Dr
- 4602 Hathaway Dr
- 4475 S 1975 W
- 2038 W 4600 S
- 2082 W 4450 S
- 2015 W 4225 S
- 4220 S 2075 W
- 4205 S 2075 W
- 4328 S 2175 W
- 2067 W 4750 S