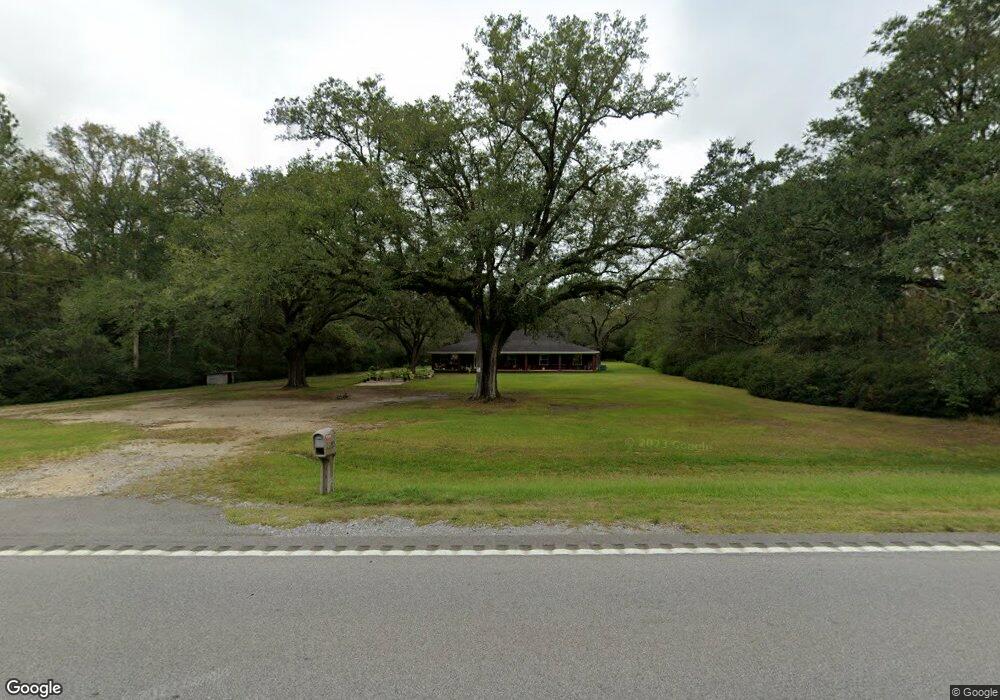
17837 Highway 63 Moss Point, MS 39562
Estimated Value: $306,000 - $345,000
4
Beds
3
Baths
2,900
Sq Ft
$113/Sq Ft
Est. Value
About This Home
This home is located at 17837 Highway 63, Moss Point, MS 39562 and is currently estimated at $326,704, approximately $112 per square foot. 17837 Highway 63 is a home located in Jackson County with nearby schools including East Central Lower Elementary School, East Central Upper Elementary School, and East Central Middle School.
Ownership History
Date
Name
Owned For
Owner Type
Purchase Details
Closed on
Aug 4, 2023
Sold by
D And P Properties Llc
Bought by
Bennett Ezra W and Bennett Misty D
Current Estimated Value
Home Financials for this Owner
Home Financials are based on the most recent Mortgage that was taken out on this home.
Original Mortgage
$281,950
Outstanding Balance
$274,270
Interest Rate
6.71%
Mortgage Type
New Conventional
Estimated Equity
$52,434
Purchase Details
Closed on
Aug 10, 2022
Sold by
Simmons William C
Bought by
Condreay Kaley B
Purchase Details
Closed on
May 27, 2022
Sold by
D And P Properties Llc
Bought by
Condreay Kaley B and Condreay Dustin
Purchase Details
Closed on
Jan 31, 2022
Sold by
Underwood Law Firm Pllc
Bought by
D And P Properties Llc
Create a Home Valuation Report for This Property
The Home Valuation Report is an in-depth analysis detailing your home's value as well as a comparison with similar homes in the area
Purchase History
| Date | Buyer | Sale Price | Title Company |
|---|---|---|---|
| Bennett Ezra W | -- | None Listed On Document | |
| Bennett Ezra W | -- | None Listed On Document | |
| Condreay Kaley B | -- | Lott Law Firm | |
| Condreay Kaley B | -- | None Listed On Document | |
| D And P Properties Llc | $176,000 | Underwood Law Firm Pllc |
Source: Public Records
Mortgage History
| Date | Status | Borrower | Loan Amount |
|---|---|---|---|
| Open | Bennett Ezra W | $281,950 | |
| Closed | Bennett Ezra W | $281,950 |
Source: Public Records
Tax History
| Year | Tax Paid | Tax Assessment Tax Assessment Total Assessment is a certain percentage of the fair market value that is determined by local assessors to be the total taxable value of land and additions on the property. | Land | Improvement |
|---|---|---|---|---|
| 2025 | $3,430 | $28,863 | $1,800 | $27,063 |
| 2024 | $3,430 | $17,171 | $1,167 | $16,004 |
| 2023 | $2,061 | $25,757 | $1,751 | $24,006 |
| 2022 | $1,703 | $17,171 | $1,167 | $16,004 |
| 2021 | $1,711 | $17,246 | $1,167 | $16,079 |
| 2020 | $1,704 | $16,591 | $1,081 | $15,510 |
| 2019 | $1,682 | $16,591 | $1,081 | $15,510 |
| 2018 | $1,722 | $16,602 | $1,081 | $15,521 |
| 2017 | $1,757 | $16,602 | $1,081 | $15,521 |
| 2016 | $1,675 | $16,602 | $1,081 | $15,521 |
| 2015 | $1,532 | $153,180 | $10,810 | $142,370 |
| 2014 | $1,625 | $16,383 | $1,081 | $15,302 |
| 2013 | $1,561 | $16,383 | $1,081 | $15,302 |
Source: Public Records
Map
Nearby Homes
- 17209 Red Top Ln
- 19500 Angel Ln
- 19506 Highway 63
- 3016 Ed Parker Rd
- 20700 Cameron Ln
- 0 Grafe Homestead Rd Unit 4137349
- Tbd Hurley Wade Rd
- 0 Dr Unit 4052148
- 0 River Walk Dr
- 7201 Bentwood Dr
- 13875 Wolf Ridge Rd Unit LotWP001
- 0 River Place Unit 4143478
- 26.1 Acres Brinkman Rd E
- Lot 111 River Place
- 0 River Bluffs Lot 33 Dr
- 2337 Connors Blvd
- 0 R B Dickerson Rd
- 7521 Townsite Rd
- 2212 Sampras Blvd
- 5402 Huckleberry Ln
- 17837 Highway 63
- 17729 Highway 63
- 2813 Lum Cumbest Rd
- 18000 John Cumbest Rd
- 18101 Highway 63
- 18018 John Cumbest Rd
- 17900 John Cumbest Rd
- 2900 Lum Cumbest Rd
- 2601 Roy Cumbest Rd
- 2913 Lum Cumbest Rd
- 17721 Highway 63
- 17732 Highway 63
- 17720 Highway 63
- 18024 John Cumbest Rd
- 2930 Lum Cumbest Rd
- 18009 John Cumbest Rd
- 17901 John Cumbest Rd
- 17735 John Cumbest Rd
- 17811 John Cumbest Rd
- 3004 Lum Cumbest Rd
Your Personal Tour Guide
Ask me questions while you tour the home.