Estimated Value: $286,000 - $298,356
2
Beds
2
Baths
1,550
Sq Ft
$188/Sq Ft
Est. Value
About This Home
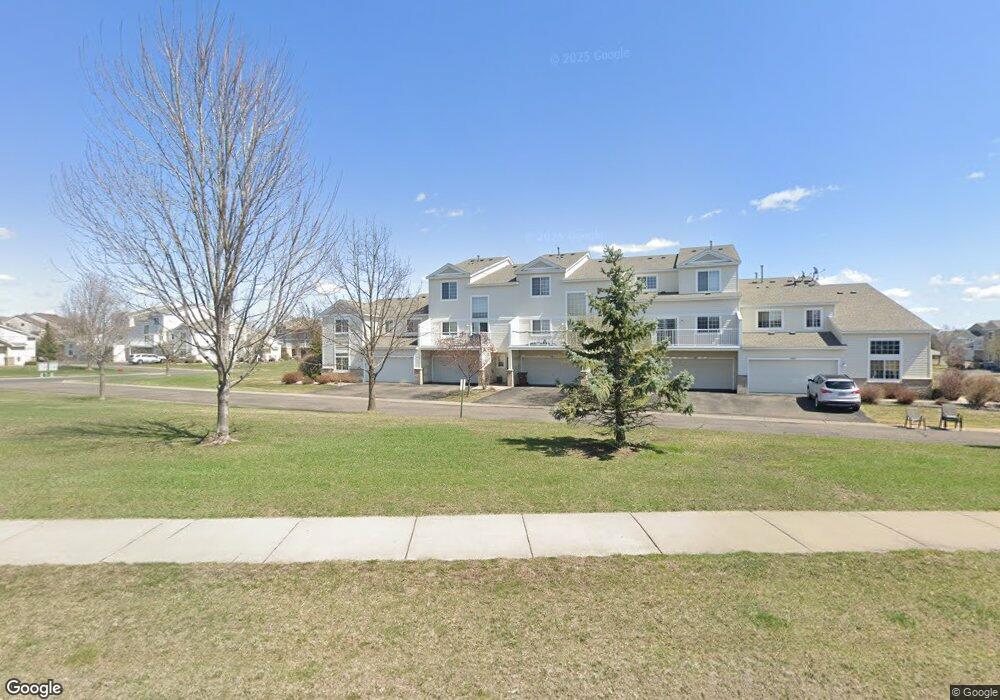
This home is located at 17843 66th Ave N, Osseo, MN 55311 and is currently estimated at $291,839, approximately $188 per square foot. 17843 66th Ave N is a home located in Hennepin County with nearby schools including Basswood Elementary School, Maple Grove Middle School, and Maple Grove Senior High School.
Ownership History
Date
Name
Owned For
Owner Type
Purchase Details
Closed on
Jul 20, 2021
Sold by
Martinek Joel D
Bought by
Koubaytari Mohammed Jamel
Current Estimated Value
Home Financials for this Owner
Home Financials are based on the most recent Mortgage that was taken out on this home.
Original Mortgage
$266,000
Outstanding Balance
$241,354
Interest Rate
2.9%
Mortgage Type
New Conventional
Estimated Equity
$50,485
Purchase Details
Closed on
Feb 10, 2018
Sold by
Martinek Sara
Bought by
Martinek Joel D
Purchase Details
Closed on
Apr 28, 2017
Sold by
Boeving Rachel and Boeving Thomas
Bought by
Martinek Joel D
Home Financials for this Owner
Home Financials are based on the most recent Mortgage that was taken out on this home.
Original Mortgage
$149,200
Interest Rate
3.75%
Mortgage Type
Adjustable Rate Mortgage/ARM
Purchase Details
Closed on
Sep 22, 2006
Sold by
U S Home Corp
Bought by
Not Provided
Create a Home Valuation Report for This Property
The Home Valuation Report is an in-depth analysis detailing your home's value as well as a comparison with similar homes in the area
Home Values in the Area
Average Home Value in this Area
Purchase History
| Date | Buyer | Sale Price | Title Company |
|---|---|---|---|
| Koubaytari Mohammed Jamel | $280,000 | Minnesota Title | |
| Martinek Joel D | -- | None Available | |
| Martinek Joel D | $186,500 | Minnesota Title | |
| Not Provided | $195,675 | -- | |
| Koubaytari Muhammed Muhammed | $280,000 | -- |
Source: Public Records
Mortgage History
| Date | Status | Borrower | Loan Amount |
|---|---|---|---|
| Open | Koubaytari Mohammed Jamel | $266,000 | |
| Previous Owner | Martinek Joel D | $149,200 |
Source: Public Records
Tax History Compared to Growth
Tax History
| Year | Tax Paid | Tax Assessment Tax Assessment Total Assessment is a certain percentage of the fair market value that is determined by local assessors to be the total taxable value of land and additions on the property. | Land | Improvement |
|---|---|---|---|---|
| 2024 | $2,913 | $258,200 | $69,700 | $188,500 |
| 2023 | $2,994 | $265,700 | $77,700 | $188,000 |
| 2022 | $2,514 | $268,100 | $70,600 | $197,500 |
| 2021 | $2,428 | $221,400 | $48,400 | $173,000 |
| 2020 | $2,298 | $211,500 | $44,200 | $167,300 |
| 2019 | $2,268 | $192,800 | $36,700 | $156,100 |
| 2018 | $2,233 | $181,400 | $36,200 | $145,200 |
| 2017 | $2,340 | $159,800 | $36,500 | $123,300 |
| 2016 | $2,227 | $149,900 | $31,000 | $118,900 |
| 2015 | $1,867 | $142,000 | $31,000 | $111,000 |
| 2014 | -- | $127,000 | $27,000 | $100,000 |
Source: Public Records
Map
Nearby Homes
- 6647 Peony Ln N
- 17812 66th Ave N
- 6566 Merrimac Ln N
- 17716 Elm Rd N
- 6508 Merrimac Ln N Unit 6508
- 6750 Troy Ln N
- 6860 Peony Ln N
- 6848 Troy Ln N
- 6757 Urbandale Ln N
- 17673 69th Place N
- 6300 Ranier Ln N
- 17549 70th Place N
- 6540 Yellowstone Ln N
- 17700 71st Ave N
- 6287 Fountain Ln N
- 6205 Ranier Ln N
- 6324 Fountain Ln N
- 17749 62nd Ave N
- 20144 68th Ave N
- 17390 72nd Ave N Unit 1301
- 17869 66th Ave N
- 17863 66th Ave N
- 17847 66th Ave N
- 17845 66th Ave N
- 17841 66th Ave N
- 17867 66th Ave N
- 17865 66th Ave N
- 17861 66th Ave N
- 17852 17852 66th-Avenue-n
- 17870 17870 66th Ave N
- 17827 66th Ave N
- 17823 66th Ave N
- 17821 66th Ave N
- 6605 Olive Ln N
- 6603 Olive Ln N
- 17825 66th Ave N
- 6607 Olive Ln N
- 6601 Olive Ln N
- 6599 Olive Ln N
- 17924 17924 66th-Avenue-n