17844 Creciente Way San Diego, CA 92127
Rancho Bernardo NeighborhoodEstimated Value: $1,283,322 - $1,571,000
3
Beds
2
Baths
1,981
Sq Ft
$707/Sq Ft
Est. Value
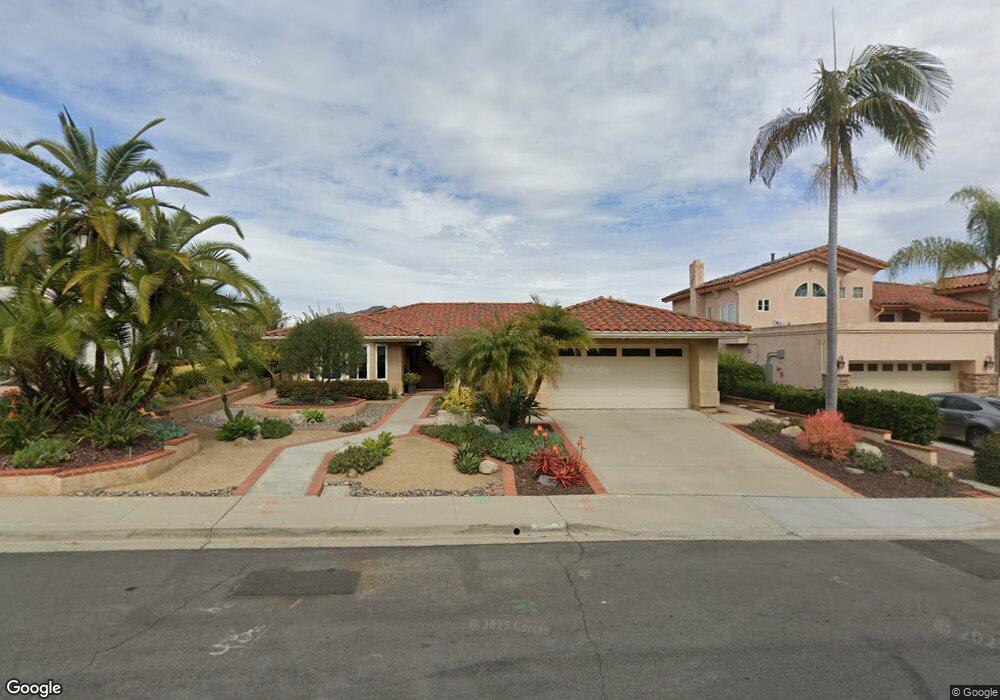
About This Home
This home is located at 17844 Creciente Way, San Diego, CA 92127 and is currently estimated at $1,400,831, approximately $707 per square foot. 17844 Creciente Way is a home located in San Diego County with nearby schools including Westwood Elementary School, Bernardo Heights Middle, and Rancho Bernardo High.
Ownership History
Date
Name
Owned For
Owner Type
Purchase Details
Closed on
Apr 15, 1998
Sold by
Shaw Jay H and Shaw Susan J
Bought by
Shaw Jay H and Shaw Susan Jean
Current Estimated Value
Home Financials for this Owner
Home Financials are based on the most recent Mortgage that was taken out on this home.
Original Mortgage
$252,000
Outstanding Balance
$45,087
Interest Rate
7.12%
Estimated Equity
$1,355,744
Purchase Details
Closed on
Feb 20, 1998
Sold by
Todd Kennedy C and Todd Diane M
Bought by
Shaw Jay H and Shaw Susan J
Home Financials for this Owner
Home Financials are based on the most recent Mortgage that was taken out on this home.
Original Mortgage
$252,000
Outstanding Balance
$45,087
Interest Rate
7.12%
Estimated Equity
$1,355,744
Purchase Details
Closed on
Jul 9, 1993
Sold by
Johnson Newton E and Johnson Brenda F
Bought by
Kennedy C K Todd and Kennedy Diane M
Home Financials for this Owner
Home Financials are based on the most recent Mortgage that was taken out on this home.
Original Mortgage
$238,500
Interest Rate
7.16%
Purchase Details
Closed on
May 2, 1985
Create a Home Valuation Report for This Property
The Home Valuation Report is an in-depth analysis detailing your home's value as well as a comparison with similar homes in the area
Home Values in the Area
Average Home Value in this Area
Purchase History
| Date | Buyer | Sale Price | Title Company |
|---|---|---|---|
| Shaw Jay H | -- | -- | |
| Shaw Jay H | $315,000 | First American Title Ins Co | |
| Kennedy C K Todd | $265,000 | First American Title Co | |
| -- | $177,500 | -- |
Source: Public Records
Mortgage History
| Date | Status | Borrower | Loan Amount |
|---|---|---|---|
| Open | Shaw Jay H | $252,000 | |
| Previous Owner | Kennedy C K Todd | $238,500 |
Source: Public Records
Tax History Compared to Growth
Tax History
| Year | Tax Paid | Tax Assessment Tax Assessment Total Assessment is a certain percentage of the fair market value that is determined by local assessors to be the total taxable value of land and additions on the property. | Land | Improvement |
|---|---|---|---|---|
| 2025 | $6,181 | $562,145 | $244,292 | $317,853 |
| 2024 | $6,181 | $551,123 | $239,502 | $311,621 |
| 2023 | $6,049 | $540,317 | $234,806 | $305,511 |
| 2022 | $5,947 | $529,723 | $230,202 | $299,521 |
| 2021 | $5,868 | $519,338 | $225,689 | $293,649 |
| 2020 | $5,788 | $514,013 | $223,375 | $290,638 |
| 2019 | $5,637 | $503,936 | $218,996 | $284,940 |
| 2018 | $5,477 | $494,055 | $214,702 | $279,353 |
| 2017 | $83 | $484,369 | $210,493 | $273,876 |
| 2016 | $5,219 | $474,872 | $206,366 | $268,506 |
| 2015 | $4,597 | $418,491 | $203,267 | $215,224 |
| 2014 | $4,488 | $410,295 | $199,286 | $211,009 |
Source: Public Records
Map
Nearby Homes
- 17892 Creciente Way
- 17924 Cabela Dr
- 18103 Smokesignal Dr
- 11515 Escoba Place
- 18153 Chretien Ct
- 17885 Caminito Pinero Unit 255
- 18650 Caminito Cantilena Unit 291
- 18557 Caminito Pasadero Unit 389
- 18515 Caminito Pasadero Unit 347
- 17544 Ashburton Rd
- 18752 Caminito Cantilena Unit 176
- 11915 Fairhope Rd
- 18812 Caminito Cantilena Unit 124
- 17784 Via Gracia
- 18771 Caminito Pasadero Unit 66
- 11364 Poblado Rd
- 11864 Bernardo Terrace Unit C
- 12434 Cloudesly Dr
- 17165 W Bernardo Dr Unit 205
- 17185 W Bernardo Dr Unit 203
- 17852 Creciente Way
- 17836 Creciente Way
- 17860 Creciente Way
- 11535 Alborada Dr
- 11549 Alborada Dr
- 17828 Creciente Way
- 11467 Alborada Dr
- 11555 Alborada Dr
- 11529 Alborada Dr
- 17868 Creciente Way
- 11569 Alborada Dr
- 17820 Creciente Way
- 11324 Creciente Ct
- 11519 Alborada Dr
- 11404 Alborada Dr
- 11575 Alborada Dr Unit 7
- 17876 Creciente Way
- 17812 Creciente Way
- 11509 Alborada Dr
- 11334 Creciente Ct