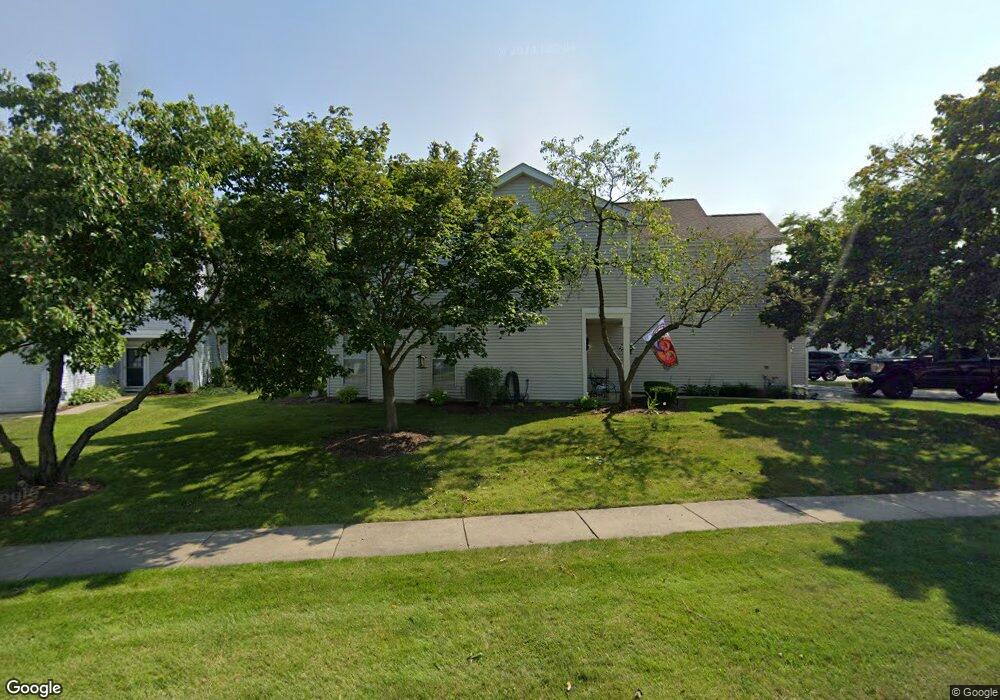
17849 W Salisbury Dr Unit 151 Gurnee, IL 60031
Estimated Value: $249,000 - $266,000
2
Beds
3
Baths
1,268
Sq Ft
$202/Sq Ft
Est. Value
About This Home
This home is located at 17849 W Salisbury Dr Unit 151, Gurnee, IL 60031 and is currently estimated at $256,298, approximately $202 per square foot. 17849 W Salisbury Dr Unit 151 is a home located in Lake County with nearby schools including Woodland Primary School, Woodland Intermediate School, and Woodland Elementary School.
Ownership History
Date
Name
Owned For
Owner Type
Purchase Details
Closed on
Jan 10, 2025
Sold by
Wedge Bradley R and Wedge Seth Mae
Bought by
Riesterer Debbie L
Current Estimated Value
Purchase Details
Closed on
Aug 11, 2021
Sold by
Wedge Bradley R
Bought by
Wedge Bradley R and Wedge Brandon David
Purchase Details
Closed on
May 18, 2021
Sold by
Hughes Julia
Bought by
Wedge Bradley R and Wedge Kerry M
Home Financials for this Owner
Home Financials are based on the most recent Mortgage that was taken out on this home.
Original Mortgage
$166,200
Interest Rate
3%
Mortgage Type
New Conventional
Purchase Details
Closed on
Nov 16, 2018
Sold by
Aiken Jillian
Bought by
Hughes Julia
Home Financials for this Owner
Home Financials are based on the most recent Mortgage that was taken out on this home.
Original Mortgage
$128,700
Interest Rate
5.12%
Mortgage Type
New Conventional
Purchase Details
Closed on
Jun 2, 2015
Sold by
North Shore Holdings Ltd
Bought by
Aiken Jillian
Home Financials for this Owner
Home Financials are based on the most recent Mortgage that was taken out on this home.
Original Mortgage
$107,200
Interest Rate
3.63%
Mortgage Type
New Conventional
Purchase Details
Closed on
Feb 19, 2015
Sold by
Akers
Bought by
North Shore Holdings Ltd
Purchase Details
Closed on
Jul 15, 2005
Sold by
Bernales Jeffrey and Bernales Dezerine L
Bought by
Akers Michael B and Benz Amber E
Home Financials for this Owner
Home Financials are based on the most recent Mortgage that was taken out on this home.
Original Mortgage
$170,984
Interest Rate
5.71%
Mortgage Type
FHA
Purchase Details
Closed on
Jun 23, 2003
Sold by
Holliday Priscilla A
Bought by
Bernales Jeffrey and Bernales Dezerine L
Home Financials for this Owner
Home Financials are based on the most recent Mortgage that was taken out on this home.
Original Mortgage
$161,715
Interest Rate
5.36%
Mortgage Type
FHA
Purchase Details
Closed on
Dec 19, 2000
Sold by
Edwards Bryan M and Edwards Michelle M
Bought by
Holliday Priscilla A
Home Financials for this Owner
Home Financials are based on the most recent Mortgage that was taken out on this home.
Original Mortgage
$90,000
Interest Rate
7.69%
Purchase Details
Closed on
Oct 1, 1993
Sold by
Harris Bank Hinsdale
Bought by
Edwards Bryan M and Lukasik Michelle M
Home Financials for this Owner
Home Financials are based on the most recent Mortgage that was taken out on this home.
Original Mortgage
$98,900
Interest Rate
7%
Mortgage Type
FHA
Create a Home Valuation Report for This Property
The Home Valuation Report is an in-depth analysis detailing your home's value as well as a comparison with similar homes in the area
Home Values in the Area
Average Home Value in this Area
Purchase History
| Date | Buyer | Sale Price | Title Company |
|---|---|---|---|
| Riesterer Debbie L | $250,000 | Chicago Title | |
| Wedge Bradley R | -- | None Listed On Document | |
| Wedge Bradley R | $175,000 | Attorneys Title Guaranty Fund | |
| Hughes Julia | $143,000 | First American Title | |
| Aiken Jillian | $134,000 | Saturn Title Llc | |
| North Shore Holdings Ltd | $70,000 | None Available | |
| Akers Michael B | $176,000 | First American Title | |
| Bernales Jeffrey | $164,000 | First American Title | |
| Holliday Priscilla A | $132,000 | -- | |
| Edwards Bryan M | $69,500 | -- |
Source: Public Records
Mortgage History
| Date | Status | Borrower | Loan Amount |
|---|---|---|---|
| Previous Owner | Wedge Bradley R | $166,200 | |
| Previous Owner | Hughes Julia | $128,700 | |
| Previous Owner | Aiken Jillian | $107,200 | |
| Previous Owner | Akers Michael B | $170,984 | |
| Previous Owner | Bernales Jeffrey | $161,715 | |
| Previous Owner | Holliday Priscilla A | $90,000 | |
| Previous Owner | Edwards Bryan M | $98,900 |
Source: Public Records
Tax History Compared to Growth
Tax History
| Year | Tax Paid | Tax Assessment Tax Assessment Total Assessment is a certain percentage of the fair market value that is determined by local assessors to be the total taxable value of land and additions on the property. | Land | Improvement |
|---|---|---|---|---|
| 2024 | $5,739 | $67,678 | $9,679 | $57,999 |
| 2023 | $4,623 | $61,002 | $8,724 | $52,278 |
| 2022 | $4,623 | $51,158 | $7,659 | $43,499 |
| 2021 | $4,047 | $47,676 | $7,138 | $40,538 |
| 2020 | $3,890 | $46,505 | $6,963 | $39,542 |
| 2019 | $3,812 | $45,155 | $6,761 | $38,394 |
| 2018 | $3,635 | $44,441 | $5,472 | $38,969 |
| 2017 | $3,637 | $43,167 | $5,315 | $37,852 |
| 2016 | $3,715 | $42,304 | $5,078 | $37,226 |
| 2015 | $3,841 | $40,121 | $4,816 | $35,305 |
| 2014 | $2,833 | $34,043 | $4,751 | $29,292 |
| 2012 | $3,187 | $38,329 | $4,787 | $33,542 |
Source: Public Records
Map
Nearby Homes
- 17775 W Braewick Rd
- 17876 W Braewick Rd
- 36077 N Bridlewood Ave
- 17820 W Braewick Rd
- 17781 W Elsbury St
- 36253 N Bridlewood Ave
- 36259 N Field View Dr
- 1601 Newgate Ct
- 36217 N Old Creek Ct
- 18229 W Banbury Dr
- 1603 Napa Dr
- 18325 W Lakeview Terrace
- 6797 Roanoake Ct
- 6877 W Mount Vernon Ct Unit 4A
- 6771 E Wellsley Ct
- 1593 Vineyard Dr
- 7623 Beringer Ct
- 17925 W Stearns School Rd
- 1075 Suffolk Ct
- 36712 N Traer Terrace
- 17849 W Salisbury Dr
- 17851 W Salisbury Dr
- 17847 W Salisbury Dr Unit 1
- 17845 W Salisbury Dr
- 17837 W Salisbury Dr
- 17837 W Salisbury Dr Unit 1
- 17859 W Salisbury Dr
- 17861 W Salisbury Dr
- 17835 W Salisbury Dr
- 17835 W Salisbury Dr Unit 152
- 17833 W Salisbury Dr
- 17863 W Salisbury Dr
- 17865 W Salisbury Dr
- 17867 W Salisbury Dr
- 17867 W Salisbury Dr Unit 17867
- 17869 W Salisbury Dr
- 17869 W Salisbury Dr Unit 150-17
- 17829 W Salisbury Dr
- 17819 W Salisbury Dr
- 17831 W Salisbury Dr