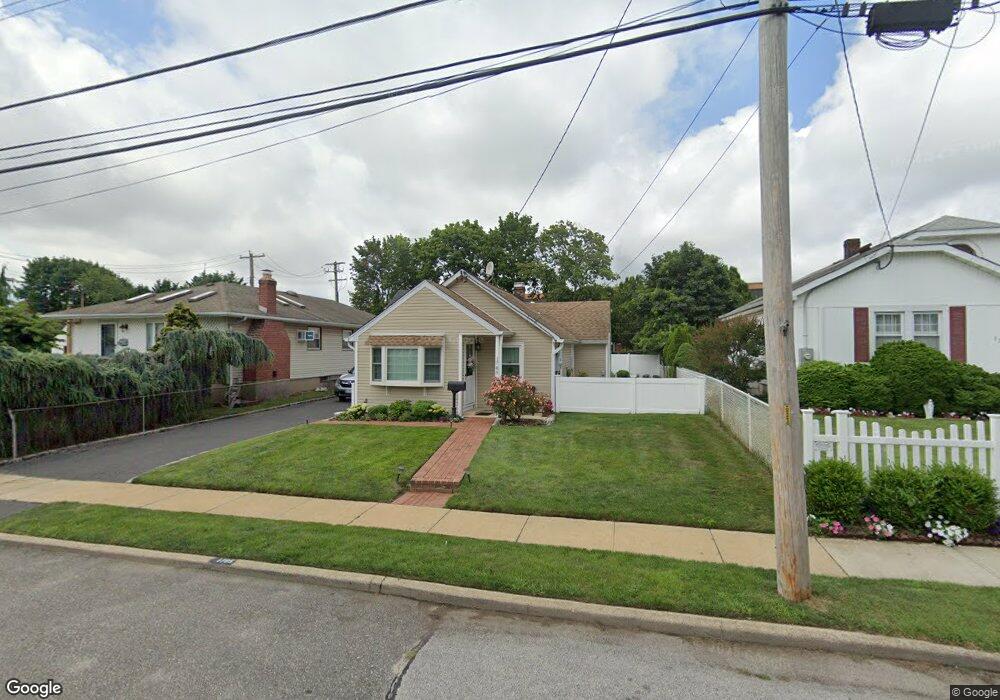
1785 Gianelli Ave Merrick, NY 11566
Estimated Value: $630,667 - $718,000
2
Beds
2
Baths
860
Sq Ft
$784/Sq Ft
Est. Value
About This Home
This home is located at 1785 Gianelli Ave, Merrick, NY 11566 and is currently estimated at $674,334, approximately $784 per square foot. 1785 Gianelli Ave is a home located in Nassau County with nearby schools including Merrick Avenue Middle School, Sanford H Calhoun High School, and Grace Christian Academy.
Ownership History
Date
Name
Owned For
Owner Type
Purchase Details
Closed on
Dec 7, 2021
Sold by
Pisciotta Victoria and Brennan Daniel
Bought by
Rae Claudia
Current Estimated Value
Purchase Details
Closed on
Dec 6, 2018
Sold by
Yeh Hsuan
Bought by
Pisciotta Victoria and Pisciotta Daniel
Home Financials for this Owner
Home Financials are based on the most recent Mortgage that was taken out on this home.
Original Mortgage
$358,560
Interest Rate
4.9%
Mortgage Type
New Conventional
Purchase Details
Closed on
Feb 5, 2015
Sold by
Calderone James
Bought by
Yeh Hsuan
Purchase Details
Closed on
Oct 3, 2005
Sold by
Sabellico Barbara
Bought by
Calderone James
Purchase Details
Closed on
Aug 28, 1995
Sold by
Sabellico Anthony and Sabellico Barbara
Bought by
Sabellico Anthony and Sabellico Barbara
Create a Home Valuation Report for This Property
The Home Valuation Report is an in-depth analysis detailing your home's value as well as a comparison with similar homes in the area
Home Values in the Area
Average Home Value in this Area
Purchase History
| Date | Buyer | Sale Price | Title Company |
|---|---|---|---|
| Rae Claudia | $540,000 | Wfg National Title | |
| Pisciotta Victoria | $432,000 | First International Title | |
| Yeh Hsuan | $3,550,000 | None Available | |
| Calderone James | $400,000 | -- | |
| Sabellico Anthony | -- | -- |
Source: Public Records
Mortgage History
| Date | Status | Borrower | Loan Amount |
|---|---|---|---|
| Previous Owner | Pisciotta Victoria | $358,560 |
Source: Public Records
Tax History
| Year | Tax Paid | Tax Assessment Tax Assessment Total Assessment is a certain percentage of the fair market value that is determined by local assessors to be the total taxable value of land and additions on the property. | Land | Improvement |
|---|---|---|---|---|
| 2025 | $10,454 | $377 | $224 | $153 |
| 2024 | $2,801 | $393 | $233 | $160 |
Source: Public Records
Map
Nearby Homes
- 1741 Bushwick Ave
- 1772 Rose St
- 1729 Gormley Ave
- 1938 Meadowbrook Rd
- TBD Camp Ave
- 1911 Carroll Ave
- 1721 Michael William Rd
- 1617 Richard Ave
- 2 Garfield St
- 1709 Camp Ave
- 221 Thelma Ave
- 1750 Henry Rd
- 49 Elizabeth St
- 1680 Lake Ave
- 19 Margaret Blvd
- 49 Prospect St
- 1931 Miller Place
- 9 Bainbridge St
- 1531 Merrick Ave
- 25 Bainbridge St
- 1791 Gianelli Ave
- 1789 Gianelli Ave
- 1801 Short Place
- 1797 Gianelli Ave
- 1801 Gianelli Ave
- 35 Gianelli Ave
- 31 Gianelli Ave
- 1800 Short Place
- 39 Gianelli Ave
- 1194 Gianelli Ave
- 1790 Short Place
- 1800 Gianelli Ave
- 1774 Gianelli Ave
- 1805 Gianelli Ave
- 19 Gianelli Ave
- 48 Gianelli Ave
- 1768 Gianelli Ave
- 1777 Horatio Ave
- 1793 Horatio Ave
- 1773 Horatio Ave