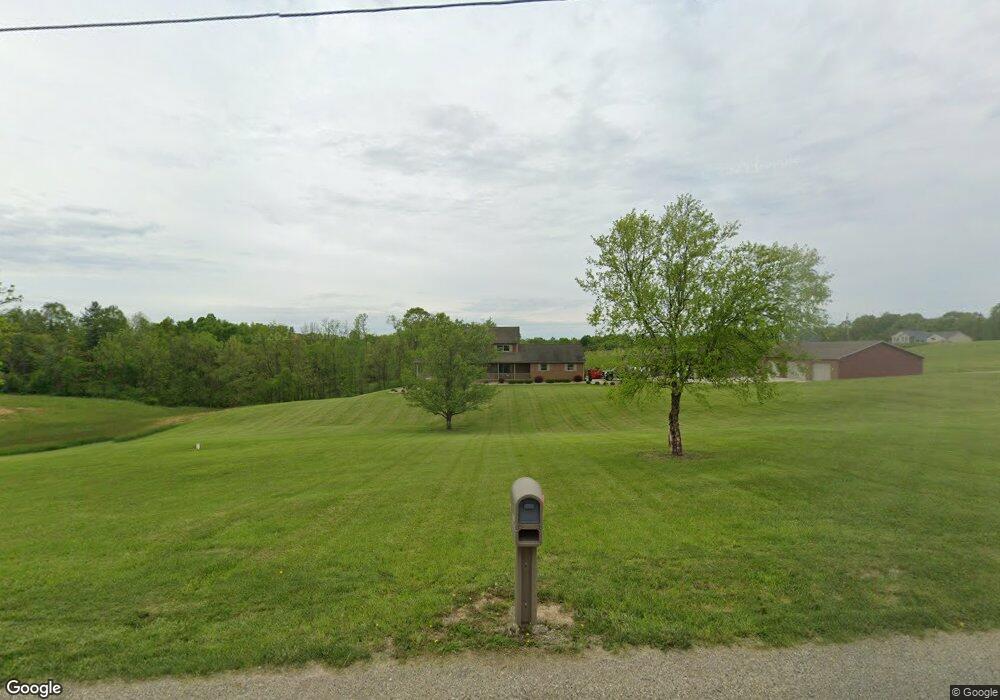
1785 Maple Brook Rd New Concord, OH 43762
Estimated Value: $362,000 - $645,650
4
Beds
3
Baths
2,400
Sq Ft
$212/Sq Ft
Est. Value
About This Home
This home is located at 1785 Maple Brook Rd, New Concord, OH 43762 and is currently estimated at $509,550, approximately $212 per square foot. 1785 Maple Brook Rd is a home located in Muskingum County with nearby schools including New Concord Elementary School, East Muskingum Middle School, and Larry Miller Intermediate Elementary School.
Ownership History
Date
Name
Owned For
Owner Type
Purchase Details
Closed on
Nov 15, 2021
Sold by
Brown Dustin Edmund and Brown Mindy Lell
Bought by
Brown Dustin Edmund and Bronw Mindy Lell
Current Estimated Value
Purchase Details
Closed on
Dec 16, 2010
Sold by
Smith William J
Bought by
Revoca Smith William Jefferson and Revoca William Jefferson Smith
Purchase Details
Closed on
Oct 20, 2006
Sold by
Estate Of Carole J Smith
Bought by
Smith William J
Purchase Details
Closed on
Sep 6, 2001
Sold by
Smith William J
Bought by
Brown Dustin E and Brown Mindy L
Purchase Details
Closed on
Aug 1, 2000
Sold by
Waltz William P
Bought by
Smith William J and Smith Carole J
Create a Home Valuation Report for This Property
The Home Valuation Report is an in-depth analysis detailing your home's value as well as a comparison with similar homes in the area
Purchase History
| Date | Buyer | Sale Price | Title Company |
|---|---|---|---|
| Brown Dustin Edmund | -- | None Available | |
| Revoca Smith William Jefferson | -- | Attorney | |
| Smith William J | -- | None Available | |
| Brown Dustin E | $50,000 | -- | |
| Smith William J | $6,000 | -- |
Source: Public Records
Tax History
| Year | Tax Paid | Tax Assessment Tax Assessment Total Assessment is a certain percentage of the fair market value that is determined by local assessors to be the total taxable value of land and additions on the property. | Land | Improvement |
|---|---|---|---|---|
| 2024 | $5,800 | $170,240 | $17,955 | $152,285 |
| 2023 | $5,284 | $144,935 | $14,385 | $130,550 |
| 2022 | $5,129 | $143,640 | $14,385 | $129,255 |
| 2021 | $5,067 | $143,640 | $14,385 | $129,255 |
| 2020 | $4,361 | $119,735 | $12,005 | $107,730 |
| 2019 | $4,339 | $119,735 | $12,005 | $107,730 |
| 2018 | $4,433 | $119,735 | $12,005 | $107,730 |
| 2017 | $4,175 | $109,410 | $11,340 | $98,070 |
| 2016 | $4,182 | $109,410 | $11,340 | $98,070 |
| 2015 | $4,281 | $109,410 | $11,340 | $98,070 |
| 2013 | $4,524 | $109,410 | $11,340 | $98,070 |
Source: Public Records
Map
Nearby Homes
- 470 Nel da Mar Dr
- 0 Homestead Dr Unit 11611647
- 0 Homestead Dr Unit 5174212
- 170 Thompson Ave
- 112 Thompson Ave
- 160 N Liberty St
- 0 Rix Mills Rd
- 67 E Main St
- 110 Cherry Ln
- 0 Maple Ln
- 135 S Moose Eye Rd
- 101 N Sundale Rd
- 9380 Pidcock Rd
- 1420 Glenn Hwy
- 10050 Norwich Dr
- 100 Linvale Dr
- 515 Norwich Valley Rd
- 60999 Greenbriar Dr
- 61220 Kadon Dr
- 3950 Arch Hill Rd
- 0 Wild Turkey Ln Unit 3687241
- 1985 Wild Turkey Ln
- 1600 Maple Brook Rd
- 1965 Wild Turkey Ln
- 1700 Maple Brook Rd
- 1560 Maple Brook Rd
- 1945 Wild Turkey Ln
- 1470 Maple Brook Rd
- 1885 Wild Turkey Ln
- 1330 Maple Brook Rd
- 1905 Wild Turkey Ln
- 2000 Shadyside Dr
- 2065 Maple Brook Rd
- 1295 Maple Brook Rd
- 1835 Maple Brook Rd
- 1750 Shadyside Dr
- 1750 Shadyside Dr
- 1235 Maple Brook Rd
- 2100 Maple Brook Rd
- 2100 Maplebrook Rd
Your Personal Tour Guide
Ask me questions while you tour the home.