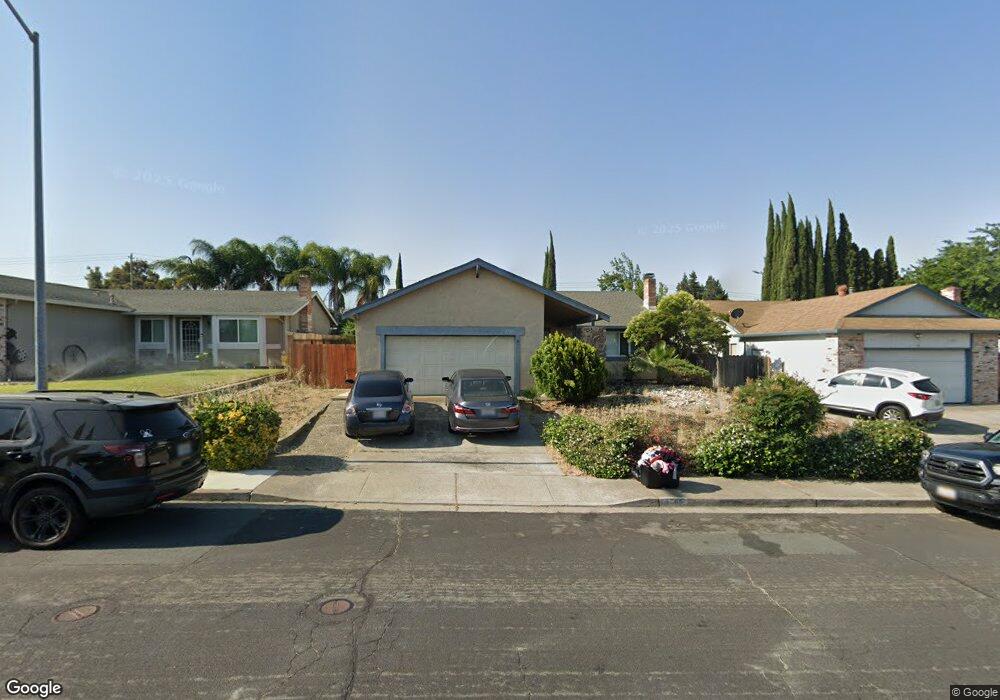
1785 Port Way Oakley, CA 94561
Estimated Value: $576,000 - $618,000
3
Beds
2
Baths
1,488
Sq Ft
$400/Sq Ft
Est. Value
About This Home
This home is located at 1785 Port Way, Oakley, CA 94561 and is currently estimated at $594,571, approximately $399 per square foot. 1785 Port Way is a home located in Contra Costa County with nearby schools including Oakley Elementary School, O'Hara Park Middle School, and Freedom High School.
Ownership History
Date
Name
Owned For
Owner Type
Purchase Details
Closed on
Dec 17, 2021
Sold by
Kang and Suyi
Bought by
Li James and Kang Rong
Current Estimated Value
Purchase Details
Closed on
Dec 9, 2014
Sold by
Wells Fargo Bank Na
Bought by
Kang Rong and Shao Suyi
Purchase Details
Closed on
Aug 21, 2014
Sold by
Rodriquez Nick and Rodriquez Carmen A
Bought by
Wells Fargo Bank Na
Purchase Details
Closed on
Oct 20, 2006
Sold by
Bickar Daniel W and Bickar Debbie
Bought by
Rodriguez Nick and Rodriguez Carmen A
Home Financials for this Owner
Home Financials are based on the most recent Mortgage that was taken out on this home.
Original Mortgage
$425,000
Interest Rate
6.39%
Mortgage Type
Balloon
Purchase Details
Closed on
Sep 21, 1994
Sold by
Bailey Patricia A
Bought by
Bickar Daniel W and Bickar Debbie
Home Financials for this Owner
Home Financials are based on the most recent Mortgage that was taken out on this home.
Original Mortgage
$138,599
Interest Rate
8.58%
Mortgage Type
FHA
Create a Home Valuation Report for This Property
The Home Valuation Report is an in-depth analysis detailing your home's value as well as a comparison with similar homes in the area
Home Values in the Area
Average Home Value in this Area
Purchase History
| Date | Buyer | Sale Price | Title Company |
|---|---|---|---|
| Li James | -- | None Listed On Document | |
| Kang Rong | $253,500 | Lsi Title Inc | |
| Wells Fargo Bank Na | $240,000 | Lsi Title Inc | |
| Rodriguez Nick | $425,000 | Old Republic Title Company | |
| Bickar Daniel W | $140,000 | Placer Title Company |
Source: Public Records
Mortgage History
| Date | Status | Borrower | Loan Amount |
|---|---|---|---|
| Previous Owner | Rodriguez Nick | $425,000 | |
| Previous Owner | Bickar Daniel W | $138,599 |
Source: Public Records
Tax History Compared to Growth
Tax History
| Year | Tax Paid | Tax Assessment Tax Assessment Total Assessment is a certain percentage of the fair market value that is determined by local assessors to be the total taxable value of land and additions on the property. | Land | Improvement |
|---|---|---|---|---|
| 2025 | $4,304 | $304,660 | $132,199 | $172,461 |
| 2024 | $4,259 | $298,687 | $129,607 | $169,080 |
| 2023 | $4,259 | $292,831 | $127,066 | $165,765 |
| 2022 | $4,227 | $287,090 | $124,575 | $162,515 |
| 2021 | $4,153 | $281,462 | $122,133 | $159,329 |
| 2019 | $3,901 | $273,115 | $118,511 | $154,604 |
| 2018 | $3,806 | $267,761 | $116,188 | $151,573 |
| 2017 | $3,774 | $262,511 | $113,910 | $148,601 |
| 2016 | $3,581 | $257,365 | $111,677 | $145,688 |
| 2015 | $3,602 | $253,500 | $110,000 | $143,500 |
| 2014 | $3,629 | $261,500 | $153,823 | $107,677 |
Source: Public Records
Map
Nearby Homes
- 4334 Redwood Dr
- 1450 Gamay Cir
- 1916 Gamay Dr
- 151 Bedford Ln
- 2019 Verona Ct
- 2118 Connie Ln
- 80 Mandeville Ct
- 0 Empire Ave Unit 41111855
- 0 Empire Ave Unit 41097524
- 1541 Larkspur Ct
- 4670 Fuschia Way
- 5025 Martin St
- 2085 Springbrook Ct
- 1877 Babbe St
- 2084 Springbrook Ct
- 1927 Babbe St
- 881 Chianti Way
- 2107 Chicory Dr
- 1859 Santa fe St
- 4901 Beldin Ln
- 1773 Port Way
- 1797 Port Way
- 1784 W Cypress Rd
- 1772 W Cypress Rd
- 1796 W Cypress Rd
- 1761 Port Way
- 1809 Port Way
- 4603 Wente Ct
- 1760 W Cypress Rd
- 1808 W Cypress Rd
- 4602 Wente Ct
- 1821 Port Way
- 1751 Port Way
- 1820 W Cypress Rd
- 4619 Wente Ct
- 4618 Wente Ct
- 1833 Port Way
- 1750 Port Way
- 1731 Port Way
- 1741 Port Way