1785 W 18th Ave Eugene, OR 97402
Far West NeighborhoodEstimated Value: $465,000 - $497,000
About This Home
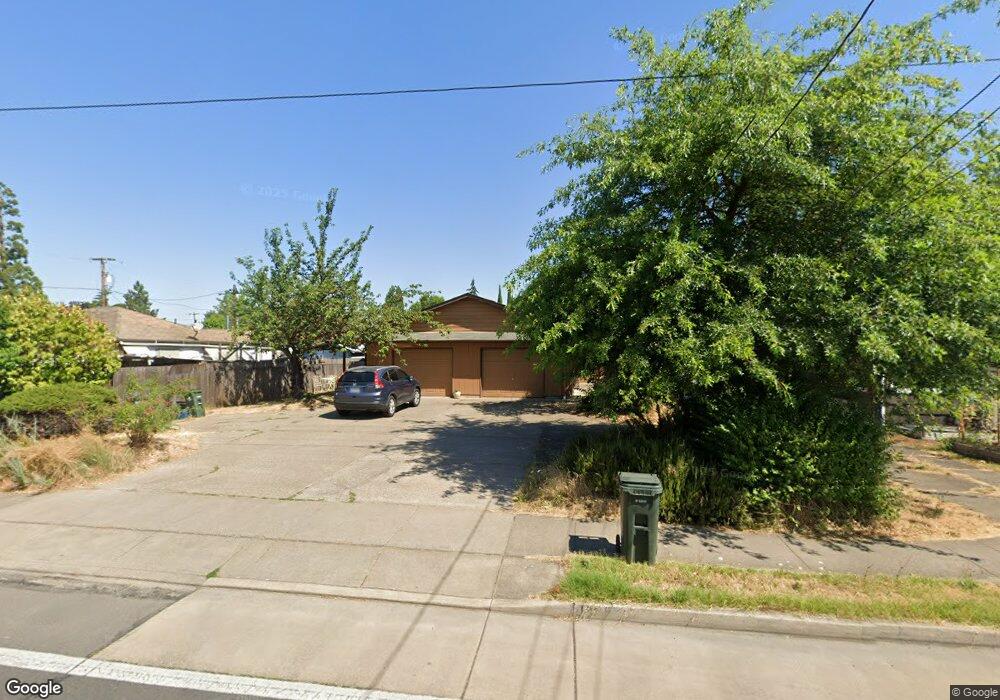
This home is located at 1785 W 18th Ave, Eugene, OR 97402 and is currently estimated at $484,255, approximately $292 per square foot. 1785 W 18th Ave is a home located in Lane County with nearby schools including Cesar Chavez Elementary School, Arts And Technology Academy At Jefferson, and Churchill High School.
Ownership History
We collect this data history from publicly available records. To have your information removed, we recommend requesting removal directly through your county’s website.
Purchase Details
Purchase Details
Purchase Details
Home Financials for this Owner
Home Financials are based on the most recent Mortgage that was taken out on this home.Purchase Details
Home Financials for this Owner
Home Financials are based on the most recent Mortgage that was taken out on this home.Home Values in the Area
Average Home Value in this Area
Purchase History
We collect this data history from publicly available records. To have your information removed, we recommend requesting removal directly through your county’s website.
| Date | Buyer | Sale Price | Title Company |
|---|---|---|---|
| -- | None Available | ||
| -- | None Available | ||
| $242,900 | Cascade Title Co | ||
| $197,000 | American Title Group |
Mortgage History
We collect this data history from publicly available records. To have your information removed, we recommend requesting removal directly through your county’s website.
| Date | Status | Borrower | Loan Amount |
|---|---|---|---|
| Open | $206,400 | ||
| Previous Owner | $157,600 | ||
| Closed | $39,400 |
Tax History
We collect this data history from publicly available records. To have your information removed, we recommend requesting removal directly through your county’s website.
| Year | Tax Paid | Tax Assessment Tax Assessment Total Assessment is a certain percentage of the fair market value that is determined by local assessors to be the total taxable value of land and additions on the property. | Land | Improvement |
|---|---|---|---|---|
| 2025 | $4,826 | $247,668 | -- | -- |
| 2024 | $4,765 | $240,455 | -- | -- |
| 2023 | $4,765 | $233,452 | $0 | $0 |
| 2022 | $4,464 | $226,653 | $0 | $0 |
| 2021 | $4,193 | $220,052 | $0 | $0 |
| 2020 | $4,208 | $213,643 | $0 | $0 |
| 2019 | $4,064 | $207,421 | $0 | $0 |
| 2018 | $3,826 | $195,515 | $0 | $0 |
| 2017 | $3,632 | $195,515 | $0 | $0 |
| 2016 | $3,378 | $189,820 | $0 | $0 |
| 2015 | $3,288 | $184,291 | $0 | $0 |
| 2014 | $3,191 | $178,923 | $0 | $0 |
Map
- 1920 Chambers St
- 1935 W 17th Ave Unit B
- 2045 W 18th Ave
- 2064 W 17th Ave
- 1619 Garfield Place Unit 1619
- 1955 Arthur St
- 2046 W 14th Place Unit 2046
- 1735 Cleveland Place
- 2121 W 15th Ct Unit 2121
- 2190 Pierce St
- 2161 W 16th Ave
- 2187 W 15th Ct Unit 2187
- 1860 W 12th Ave
- 2199 Cleveland St
- 1935 Mckinley St
- 1442 Tyler St
- 2330 W 14th Ave
- 2219 City View St
- 1255 City View St
- 1572 Mckinley Ct
- 1795 W 18th Ave
- 1775 W 18th Ave
- 1727 Grant St
- 1765 W 18th Ave Unit VRM
- 1765 W 18th Ave
- 1709 Grant St
- 1770 W 17th Ave
- 1750 Grant St
- 1790 W 18th Ave
- 1794 W 18th Ave
- 1760 W 17th Ave
- 1780 W 18th Ave
- 1710 Grant St
- 1770 W 18th Ave
- 1815 W 18th Ave
- 1804 Grant St
- 1760 W 18th Ave
- 1825 Grant St
- 1816 W 17th Ave
- 1810 Pierce St
Ask me questions while you tour the home.