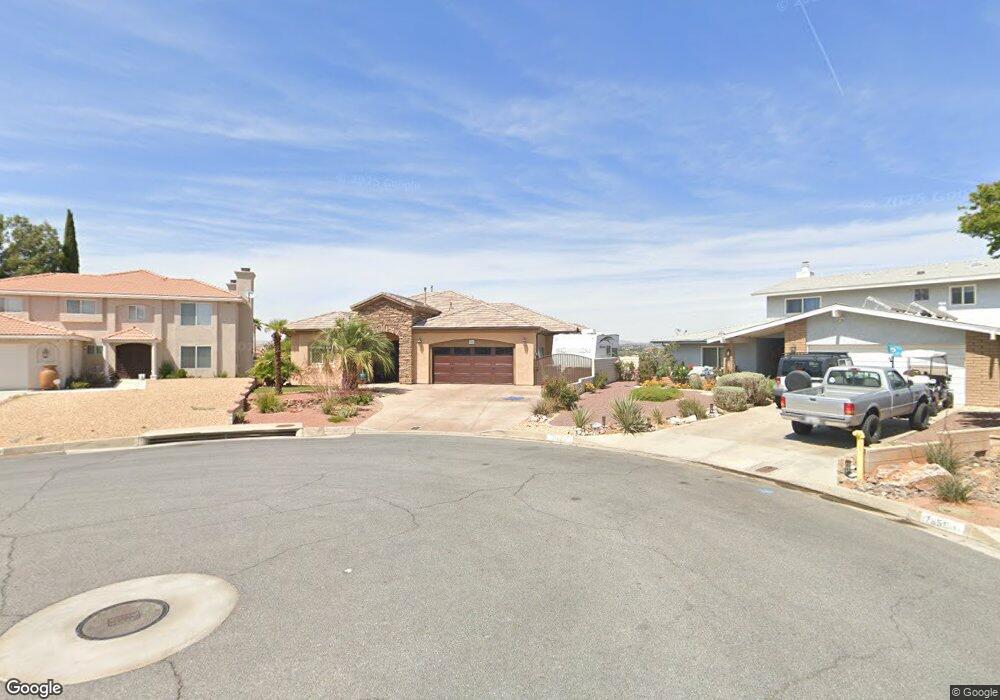
17850 Crescent Ct Victorville, CA 92395
Estimated Value: $589,725 - $657,000
4
Beds
3
Baths
2,649
Sq Ft
$239/Sq Ft
Est. Value
About This Home
This home is located at 17850 Crescent Ct, Victorville, CA 92395 and is currently estimated at $632,181, approximately $238 per square foot. 17850 Crescent Ct is a home with nearby schools including Lomitas Elementary School, Mojave Vista Elementary School, and Lakeview Leadership Academy.
Ownership History
Date
Name
Owned For
Owner Type
Purchase Details
Closed on
May 15, 2014
Sold by
Lotz Thomas G and Lotz Yvette Mae
Bought by
Thomas G Lotz & Yvette M Lotz Living Tru
Current Estimated Value
Purchase Details
Closed on
Oct 17, 2007
Sold by
Lotz Thomas G and Lotz Yvette M
Bought by
Lotz Thomas G and Lotz Yvette Mae
Home Financials for this Owner
Home Financials are based on the most recent Mortgage that was taken out on this home.
Original Mortgage
$532,000
Outstanding Balance
$330,520
Interest Rate
6.12%
Mortgage Type
New Conventional
Estimated Equity
$301,661
Purchase Details
Closed on
Aug 9, 2005
Sold by
Pace Stanley J and Pace Jane B
Bought by
Lotz Thomas G and Lotz Yvette M
Home Financials for this Owner
Home Financials are based on the most recent Mortgage that was taken out on this home.
Original Mortgage
$451,048
Interest Rate
5.67%
Mortgage Type
Construction
Create a Home Valuation Report for This Property
The Home Valuation Report is an in-depth analysis detailing your home's value as well as a comparison with similar homes in the area
Home Values in the Area
Average Home Value in this Area
Purchase History
| Date | Buyer | Sale Price | Title Company |
|---|---|---|---|
| Thomas G Lotz & Yvette M Lotz Living Tru | -- | None Available | |
| Lotz Thomas G | -- | Ticor Title Company | |
| Lotz Thomas G | $252,000 | First American Dc |
Source: Public Records
Mortgage History
| Date | Status | Borrower | Loan Amount |
|---|---|---|---|
| Open | Lotz Thomas G | $532,000 | |
| Previous Owner | Lotz Thomas G | $451,048 |
Source: Public Records
Tax History Compared to Growth
Tax History
| Year | Tax Paid | Tax Assessment Tax Assessment Total Assessment is a certain percentage of the fair market value that is determined by local assessors to be the total taxable value of land and additions on the property. | Land | Improvement |
|---|---|---|---|---|
| 2025 | $7,222 | $590,000 | $118,000 | $472,000 |
| 2024 | $7,222 | $590,000 | $118,000 | $472,000 |
| 2023 | $6,861 | $554,000 | $111,000 | $443,000 |
| 2022 | $6,880 | $554,000 | $111,000 | $443,000 |
| 2021 | $5,991 | $480,000 | $96,000 | $384,000 |
| 2020 | $5,833 | $470,700 | $93,700 | $377,000 |
| 2019 | $5,685 | $457,000 | $91,000 | $366,000 |
| 2018 | $5,778 | $434,500 | $151,100 | $283,400 |
| 2017 | $5,370 | $404,200 | $140,600 | $263,600 |
| 2016 | $4,971 | $374,300 | $130,200 | $244,100 |
| 2015 | $4,486 | $345,000 | $120,000 | $225,000 |
| 2014 | $4,321 | $327,800 | $86,300 | $241,500 |
Source: Public Records
Map
Nearby Homes
- 17850 Portside Ln
- 13685 Sierra Vista Dr
- 17830 San Gabriel Ln
- 13699 Spring Valley Pkwy
- 13660 Spring Valley Pkwy
- 13685 Hidden Valley Rd
- 13665 Hidden Valley Rd
- 13610 Sierra Vista Dr
- 17760 Honeycomb Ln
- 13710 White Sail Dr
- 13700 White Sail Dr
- 13570 Chinquapin Dr
- 17800 Rancho Bonita Rd
- 18032 Mariner Dr
- 18083 Mariner Dr
- 18091 Mariner Dr
- 17755 Rancho Bonita Rd
- 13425 Chinquapin Dr
- 13480 Spring Valley Pkwy Unit /15
- 13415 Hidden Valley Rd
- 17840 Crescent Ct
- 17860 Crescent Ct
- 13705 Chinquapin Dr
- 17855 Portside Ln
- 17840 Portside Ln
- 17855 Crescent Ct
- 13715 Chinquapin Dr
- 17865 Portside Ln
- 13685 Chinquapin Dr
- 13725 Chinquapin Dr
- 17845 Crescent Ct
- 17815 Cresta Blanca Ln
- 17875 Portside Ln
- 13700 Chinquapin Dr
- 13710 Chinquapin Dr
- 13690 Chinquapin Dr
- 17805 Cresta Blanca Ln
- 17860 Portside Ln
- 17870 Starboard Ln
- 17860 Starboard Ln