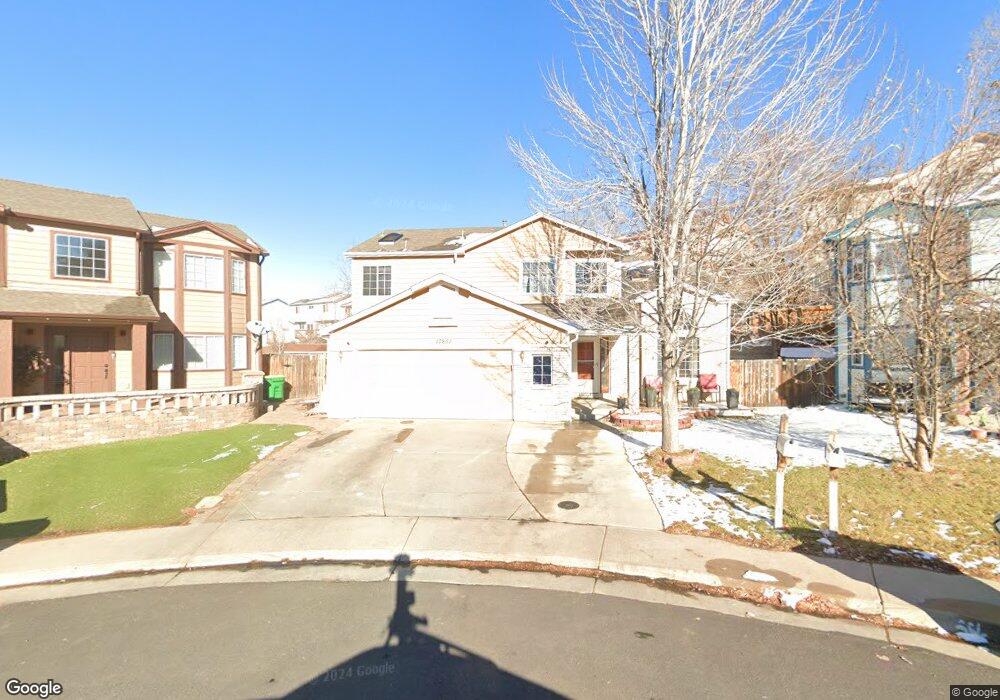
17851 E Lehigh Place Aurora, CO 80013
Carriage Place NeighborhoodEstimated Value: $517,000 - $559,000
3
Beds
3
Baths
3,360
Sq Ft
$158/Sq Ft
Est. Value
About This Home
This home is located at 17851 E Lehigh Place, Aurora, CO 80013 and is currently estimated at $531,866, approximately $158 per square foot. 17851 E Lehigh Place is a home located in Arapahoe County with nearby schools including Cimarron Elementary School, Horizon Middle School, and Smoky Hill High School.
Ownership History
Date
Name
Owned For
Owner Type
Purchase Details
Closed on
Aug 19, 2015
Sold by
Morris Matthew and Morris Melissa
Bought by
Kebede Yilma D
Current Estimated Value
Home Financials for this Owner
Home Financials are based on the most recent Mortgage that was taken out on this home.
Original Mortgage
$240,000
Outstanding Balance
$187,532
Interest Rate
4.08%
Mortgage Type
New Conventional
Estimated Equity
$344,334
Purchase Details
Closed on
Sep 4, 2009
Sold by
Imb Reo Llc
Bought by
Morris Matthew and Morris Melissa
Home Financials for this Owner
Home Financials are based on the most recent Mortgage that was taken out on this home.
Original Mortgage
$212,450
Interest Rate
5.1%
Mortgage Type
VA
Purchase Details
Closed on
Jun 1, 2009
Sold by
Hofman Christopher W
Bought by
Onewest Bank Fsb
Purchase Details
Closed on
Oct 13, 2006
Sold by
Impresto Llc
Bought by
Hofman Christopher W
Home Financials for this Owner
Home Financials are based on the most recent Mortgage that was taken out on this home.
Original Mortgage
$199,920
Interest Rate
6.37%
Mortgage Type
Purchase Money Mortgage
Purchase Details
Closed on
Aug 30, 1999
Sold by
Suarez Domingo and Suarez Marla B
Bought by
Adams Okey
Home Financials for this Owner
Home Financials are based on the most recent Mortgage that was taken out on this home.
Original Mortgage
$182,800
Interest Rate
7.68%
Purchase Details
Closed on
Nov 27, 1995
Sold by
Holiday Home Builders Inc
Bought by
Suarez Domingo and Suarez Marla B
Home Financials for this Owner
Home Financials are based on the most recent Mortgage that was taken out on this home.
Original Mortgage
$165,200
Interest Rate
7.36%
Purchase Details
Closed on
Oct 23, 1992
Sold by
Park Homes West
Bought by
Holiday Home Builders Inc
Purchase Details
Closed on
Oct 7, 1991
Sold by
Hampden Run Limited Partnership
Bought by
Park Homes West
Purchase Details
Closed on
May 15, 1991
Sold by
5850 Corp Inc
Bought by
Hampden Run Limited Partnership
Purchase Details
Closed on
Feb 11, 1991
Sold by
First Capitol Corp
Bought by
5850 Corp Inc
Purchase Details
Closed on
Nov 17, 1988
Sold by
Capitol Bldg Group Inc
Bought by
First Capitol Corp
Purchase Details
Closed on
May 6, 1987
Sold by
Conversion Arapco
Bought by
Capitol Bldg Group Inc
Purchase Details
Closed on
Feb 1, 1986
Sold by
Conversion Arapco
Bought by
Conversion Arapco
Purchase Details
Closed on
Mar 19, 1985
Bought by
Conversion Arapco
Create a Home Valuation Report for This Property
The Home Valuation Report is an in-depth analysis detailing your home's value as well as a comparison with similar homes in the area
Home Values in the Area
Average Home Value in this Area
Purchase History
| Date | Buyer | Sale Price | Title Company |
|---|---|---|---|
| Kebede Yilma D | $300,000 | Land Title Guarantee Company | |
| Morris Matthew | $208,000 | Chicago Title Co | |
| Imb Reo Llc | -- | Chicago Title Co | |
| Onewest Bank Fsb | -- | None Available | |
| Hofman Christopher W | $249,900 | None Available | |
| Adams Okey | $192,500 | -- | |
| Suarez Domingo | $173,900 | Title America | |
| Holiday Home Builders Inc | -- | -- | |
| Park Homes West | -- | -- | |
| Hampden Run Limited Partnership | -- | -- | |
| 5850 Corp Inc | -- | -- | |
| First Capitol Corp | -- | -- | |
| Capitol Bldg Group Inc | -- | -- | |
| Conversion Arapco | -- | -- | |
| Conversion Arapco | -- | -- |
Source: Public Records
Mortgage History
| Date | Status | Borrower | Loan Amount |
|---|---|---|---|
| Open | Kebede Yilma D | $240,000 | |
| Previous Owner | Morris Matthew | $212,450 | |
| Previous Owner | Hofman Christopher W | $199,920 | |
| Previous Owner | Adams Okey | $182,800 | |
| Previous Owner | Suarez Domingo | $165,200 |
Source: Public Records
Tax History
| Year | Tax Paid | Tax Assessment Tax Assessment Total Assessment is a certain percentage of the fair market value that is determined by local assessors to be the total taxable value of land and additions on the property. | Land | Improvement |
|---|---|---|---|---|
| 2025 | $2,765 | $33,719 | -- | -- |
| 2024 | $2,438 | $35,242 | -- | -- |
| 2023 | $2,438 | $35,242 | $0 | $0 |
| 2022 | $2,088 | $28,822 | $0 | $0 |
| 2021 | $2,101 | $28,822 | $0 | $0 |
| 2020 | $1,961 | $27,306 | $0 | $0 |
| 2019 | $1,892 | $27,306 | $0 | $0 |
| 2018 | $1,705 | $23,126 | $0 | $0 |
| 2017 | $1,680 | $23,126 | $0 | $0 |
| 2016 | $1,627 | $20,991 | $0 | $0 |
| 2015 | $1,548 | $20,991 | $0 | $0 |
| 2014 | $1,378 | $16,557 | $0 | $0 |
| 2013 | -- | $16,530 | $0 | $0 |
Source: Public Records
Map
Nearby Homes
- 17842 E Lehigh Place
- 17693 E Loyola Dr Unit E
- 17681 E Loyola Dr Unit E
- 17694 E Loyola Dr Unit A
- 17672 E Loyola Dr Unit 2211L
- 17683 E Loyola Dr Unit E
- 17670 E Loyola Dr Unit A
- 17519 E Kenyon Dr
- 17657 E Loyola Dr Unit D
- 17652 E Loyola Dr Unit 2031R
- 3571 S Uravan St
- 17361 E Mansfield Ave Unit 532R
- 17361 E Mansfield Ave Unit 512L
- 17642 E Loyola Dr Unit 1921L
- 17473 E Mansfield Ave Unit 112WL
- 17493 E Mansfield Ave Unit 1231L
- 17620 E Loyola Dr Unit 1731R
- 17600 E Loyola Dr Unit 1511R
- 17630 E Loyola Dr Unit 1812R
- 17595 E Mansfield Ave Unit 1331L
- 17841 E Lehigh Place
- 17861 E Lehigh Place
- 3819 S Uravan St
- 3821 S Uravan St
- 3792 S Uravan Way
- 3817 S Uravan St
- 17831 E Lehigh Place
- 3794 S Uravan Way
- 3815 S Uravan St
- 17852 E Lehigh Place
- 3784 S Uravan Way
- 17821 E Lehigh Place
- 3825 S Uravan St
- 17832 E Lehigh Place
- 3813 S Uravan St
- 3793 S Uravan Way
- 3782 S Uravan Way
- 17873 E Loyola Ave
- 17822 E Lehigh Place
- 17811 E Lehigh Place
Your Personal Tour Guide
Ask me questions while you tour the home.