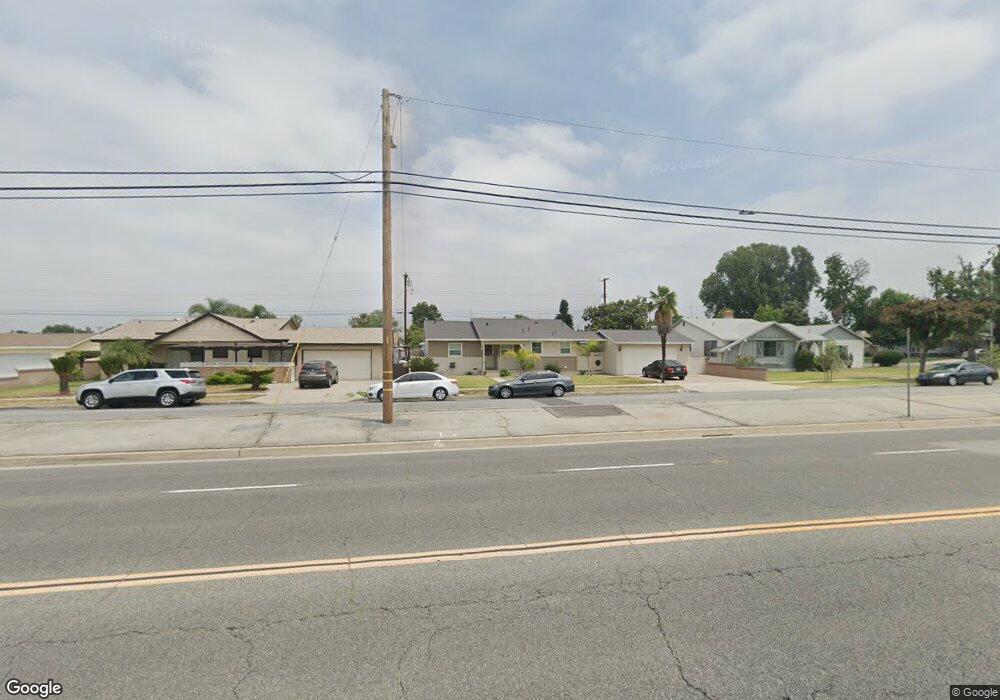
17853 E Cypress St Covina, CA 91722
Estimated Value: $664,000 - $757,000
3
Beds
2
Baths
1,208
Sq Ft
$604/Sq Ft
Est. Value
About This Home
This home is located at 17853 E Cypress St, Covina, CA 91722 and is currently estimated at $729,715, approximately $604 per square foot. 17853 E Cypress St is a home located in Los Angeles County with nearby schools including Cypress Elementary School, Las Palmas Middle School, and Northview High School.
Ownership History
Date
Name
Owned For
Owner Type
Purchase Details
Closed on
Jun 24, 2019
Sold by
Cordova Frank R and Quiroz Marie G
Bought by
Cordova Frank R and Quiroz Maria G
Current Estimated Value
Home Financials for this Owner
Home Financials are based on the most recent Mortgage that was taken out on this home.
Original Mortgage
$275,000
Outstanding Balance
$178,527
Interest Rate
4%
Mortgage Type
New Conventional
Estimated Equity
$551,188
Purchase Details
Closed on
Apr 9, 2003
Sold by
Madsen Tim
Bought by
Cordova Frank R and Quiroz Cordova Maria G
Purchase Details
Closed on
Feb 15, 2002
Sold by
Kruger Nelson L and Kruger Kare
Bought by
Grijalva Samuel V and Grijalva Esther L
Purchase Details
Closed on
Aug 10, 2001
Sold by
Kruger Nelson
Bought by
A R E K
Purchase Details
Closed on
Jan 7, 1999
Sold by
Suarez Juan Richardo
Bought by
Madsen Tim
Purchase Details
Closed on
Dec 16, 1984
Sold by
Grijalva Samuel V and Grijalva Esther L
Bought by
Suarez Juan Ricardo
Create a Home Valuation Report for This Property
The Home Valuation Report is an in-depth analysis detailing your home's value as well as a comparison with similar homes in the area
Home Values in the Area
Average Home Value in this Area
Purchase History
| Date | Buyer | Sale Price | Title Company |
|---|---|---|---|
| Cordova Frank R | -- | Stewart Title Of Ca Inc | |
| Cordova Frank R | $279,000 | Old Republic Title Company | |
| Grijalva Samuel V | -- | -- | |
| A R E K | -- | -- | |
| Madsen Tim | $100,000 | -- | |
| Suarez Juan Ricardo | $100,000 | -- |
Source: Public Records
Mortgage History
| Date | Status | Borrower | Loan Amount |
|---|---|---|---|
| Open | Cordova Frank R | $275,000 |
Source: Public Records
Tax History
| Year | Tax Paid | Tax Assessment Tax Assessment Total Assessment is a certain percentage of the fair market value that is determined by local assessors to be the total taxable value of land and additions on the property. | Land | Improvement |
|---|---|---|---|---|
| 2025 | $5,387 | $404,062 | $294,292 | $109,770 |
| 2024 | $5,087 | $396,140 | $288,522 | $107,618 |
| 2023 | $5,010 | $388,373 | $282,865 | $105,508 |
| 2022 | $4,941 | $380,759 | $277,319 | $103,440 |
| 2021 | $4,865 | $373,294 | $271,882 | $101,412 |
| 2020 | $4,800 | $369,468 | $269,095 | $100,373 |
| 2019 | $4,751 | $362,224 | $263,819 | $98,405 |
| 2018 | $4,529 | $355,123 | $258,647 | $96,476 |
| 2016 | $4,289 | $341,335 | $248,604 | $92,731 |
| 2015 | $4,168 | $336,209 | $244,870 | $91,339 |
| 2014 | $4,113 | $329,624 | $240,074 | $89,550 |
Source: Public Records
Map
Nearby Homes
- 4637 N Elspeth Way
- 17722 E Covina Blvd
- 853 N 5th Ave
- 829 Katie Place
- 832 Katie Place
- 627 W Front St
- Plan 5 at Cadence
- Plan 3 at Cadence
- 1072 N La Breda St
- 838 Lexi Ln
- 820 W Griswold Rd
- 945 Angelene Rd
- 523 N Larkin Dr
- 800 W Grondahl St Unit J
- 1288 N O Malley Ave
- 1045 N Azusa Ave Unit 191
- 1045 N Azusa Ave Unit 229
- 1045 N Azusa Ave
- 1045 N Azusa Ave Unit 251
- 1045 N Azusa Ave Unit 145
- 17845 E Cypress St
- 17859 E Cypress St
- 17836 E Benbow St
- 17824 E Benbow St
- 17844 E Benbow St
- 17837 E Cypress St
- 17864 E Cypress St
- 17820 E Benbow St
- 4562 N Heathdale Ave
- 4612 N Larkin Dr
- 4602 N Larkin Dr
- 17829 E Cypress St
- 17837 E Benbow St
- 17810 E Benbow St
- 17858 E Cypress St
- 17868 E Cypress St
- 17829 E Benbow St
- 17848 E Cypress St
- 17843 E Benbow St
- 4620 N Larkin Dr
Your Personal Tour Guide
Ask me questions while you tour the home.