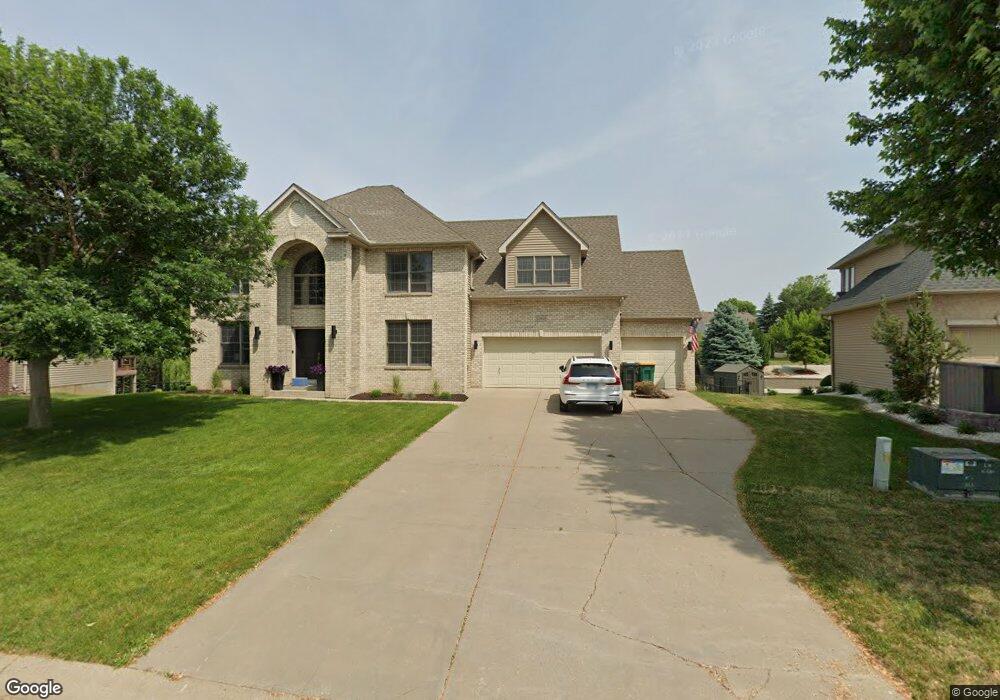
17853 Formosa Ave Lakeville, MN 55044
Estimated Value: $596,000 - $738,000
4
Beds
4
Baths
3,550
Sq Ft
$189/Sq Ft
Est. Value
About This Home
This home is located at 17853 Formosa Ave, Lakeville, MN 55044 and is currently estimated at $671,723, approximately $189 per square foot. 17853 Formosa Ave is a home located in Dakota County with nearby schools including North Trail Elementary School, Levi P. Dodge Middle School, and Farmington High School.
Ownership History
Date
Name
Owned For
Owner Type
Purchase Details
Closed on
Sep 30, 2021
Sold by
Gjerde Parris L and Gjerde Mary R
Bought by
Gosen Andrew and Gosen Heather
Current Estimated Value
Home Financials for this Owner
Home Financials are based on the most recent Mortgage that was taken out on this home.
Original Mortgage
$480,000
Outstanding Balance
$437,715
Interest Rate
2.8%
Mortgage Type
New Conventional
Estimated Equity
$234,008
Purchase Details
Closed on
Apr 24, 2009
Sold by
Greenpoint Mortgage Funding Inc
Bought by
Gjerde Parrie and Parrie Mary R
Home Financials for this Owner
Home Financials are based on the most recent Mortgage that was taken out on this home.
Original Mortgage
$340,223
Interest Rate
4.75%
Mortgage Type
FHA
Purchase Details
Closed on
Mar 14, 2006
Sold by
Chaleunsouk Thephone and Chaleunsouk Deuane Pheng
Bought by
Lor Neng
Purchase Details
Closed on
Sep 30, 2005
Sold by
D R Horton Inc
Bought by
Chaleunsouk Deuanepheng
Create a Home Valuation Report for This Property
The Home Valuation Report is an in-depth analysis detailing your home's value as well as a comparison with similar homes in the area
Home Values in the Area
Average Home Value in this Area
Purchase History
| Date | Buyer | Sale Price | Title Company |
|---|---|---|---|
| Gosen Andrew | $600,000 | Bankers Title | |
| Gjerde Parrie | $346,500 | -- | |
| Lor Neng | $675,000 | -- | |
| Chaleunsouk Deuanepheng | $564,341 | -- |
Source: Public Records
Mortgage History
| Date | Status | Borrower | Loan Amount |
|---|---|---|---|
| Open | Gosen Andrew | $480,000 | |
| Previous Owner | Gjerde Parrie | $340,223 |
Source: Public Records
Tax History Compared to Growth
Tax History
| Year | Tax Paid | Tax Assessment Tax Assessment Total Assessment is a certain percentage of the fair market value that is determined by local assessors to be the total taxable value of land and additions on the property. | Land | Improvement |
|---|---|---|---|---|
| 2024 | $7,750 | $675,300 | $123,500 | $551,800 |
| 2023 | $7,750 | $682,400 | $123,100 | $559,300 |
| 2022 | $6,400 | $651,500 | $122,700 | $528,800 |
| 2021 | $6,604 | $506,700 | $106,700 | $400,000 |
| 2020 | $7,302 | $506,300 | $101,600 | $404,700 |
| 2019 | $6,777 | $534,400 | $96,800 | $437,600 |
| 2018 | $6,575 | $499,800 | $92,100 | $407,700 |
| 2017 | $5,889 | $474,300 | $87,700 | $386,600 |
| 2016 | $6,159 | $411,500 | $83,500 | $328,000 |
| 2015 | $5,723 | $413,475 | $81,095 | $332,380 |
| 2014 | -- | $412,821 | $78,885 | $333,936 |
| 2013 | -- | $385,244 | $71,761 | $313,483 |
Source: Public Records
Map
Nearby Homes
- 17698 Fortune Trail
- 17830 Glasgow Way
- 17937 Genoa Dr
- 17934 Genoa Dr
- 17936 Genoa Dr
- 17940 Genoa Dr
- Ashton Plan at Cordelia - Freedom
- Hadley Plan at Cordelia - Freedom
- 17901 Genoa Dr
- Duncan Plan at Cordelia - Freedom
- 17942 Genoa Dr
- 17944 Genoa Dr
- 17583 Foxboro Ln
- 17891 Glasgow Way
- 17935 Giants Way
- 17896 Glasgow Way
- 17408 Gettysburg Way Unit 24184
- 17867 Flint Ave
- 6882 173rd St W
- Glacier Creek Jasmine Cottage Spec Plan at Glacier Creek
- 17853 Formosa Ct
- 17849 Formosa Ave
- 17857 Formosa Ave
- 17728 Galery Dr
- 17845 Formosa Ave
- 17845 Formosa Ct
- 17861 Formosa Ave
- 17724 Galery Dr
- 17732 Galery Dr
- 17854 Formosa Ave
- 17714 Fortune Trail
- 17846 Formosa Ave
- 17862 Formosa Ave
- 17841 Formosa Ave
- 17841 Formosa Ct
- 17865 Formosa Ave
- 17736 Galery Dr
- 17733 17733 Galery Dr
- 17842 Formosa Ave
- 17712 Fortune Trail