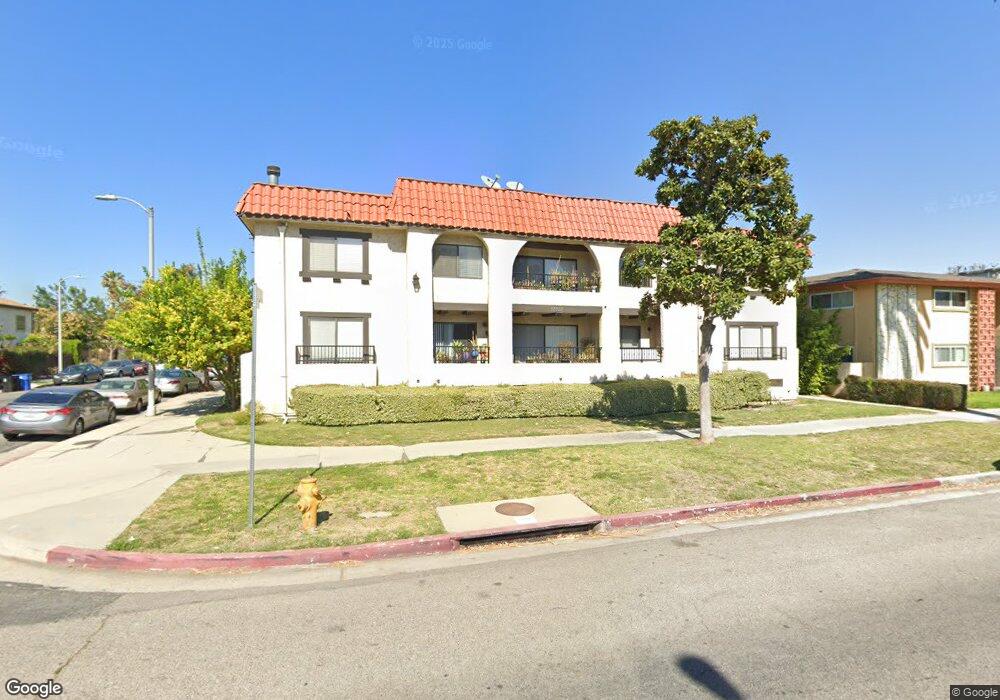
17853 Sherman Way Unit 4 Reseda, CA 91335
Estimated Value: $427,000 - $501,000
2
Beds
2
Baths
1,187
Sq Ft
$400/Sq Ft
Est. Value
About This Home
This home is located at 17853 Sherman Way Unit 4, Reseda, CA 91335 and is currently estimated at $474,719, approximately $399 per square foot. 17853 Sherman Way Unit 4 is a home located in Los Angeles County with nearby schools including Anatola Avenue Elementary School, William Mulholland Middle, and Magnolia Science Academy.
Ownership History
Date
Name
Owned For
Owner Type
Purchase Details
Closed on
Jul 25, 2019
Sold by
Gharib Shahla
Bought by
M And S Kazami Fmaily Living Trust
Current Estimated Value
Purchase Details
Closed on
Oct 4, 2018
Sold by
Kazemi Ali
Bought by
Gharib Shahla
Purchase Details
Closed on
Jun 17, 2010
Sold by
Us Bank National Association
Bought by
Kazemi Ali
Purchase Details
Closed on
Apr 2, 2010
Sold by
Brown Shonda R
Bought by
Us Bank National Association
Purchase Details
Closed on
Jan 19, 2007
Sold by
Fiedler Walter M and Fiedler Jacqueline
Bought by
Brown Shonda R
Home Financials for this Owner
Home Financials are based on the most recent Mortgage that was taken out on this home.
Original Mortgage
$252,000
Interest Rate
6.5%
Mortgage Type
Balloon
Create a Home Valuation Report for This Property
The Home Valuation Report is an in-depth analysis detailing your home's value as well as a comparison with similar homes in the area
Home Values in the Area
Average Home Value in this Area
Purchase History
| Date | Buyer | Sale Price | Title Company |
|---|---|---|---|
| M And S Kazami Fmaily Living Trust | -- | None Available | |
| Gharib Shahla | -- | None Available | |
| Kazemi Ali | $165,000 | Lawyers Title | |
| Us Bank National Association | $192,000 | Accommodation | |
| Brown Shonda R | $360,000 | First Southwestern Title Co |
Source: Public Records
Mortgage History
| Date | Status | Borrower | Loan Amount |
|---|---|---|---|
| Previous Owner | Brown Shonda R | $252,000 |
Source: Public Records
Tax History
| Year | Tax Paid | Tax Assessment Tax Assessment Total Assessment is a certain percentage of the fair market value that is determined by local assessors to be the total taxable value of land and additions on the property. | Land | Improvement |
|---|---|---|---|---|
| 2025 | $2,685 | $212,970 | $85,186 | $127,784 |
| 2024 | $2,685 | $208,795 | $83,516 | $125,279 |
| 2023 | $2,635 | $204,702 | $81,879 | $122,823 |
| 2022 | $2,513 | $200,689 | $80,274 | $120,415 |
| 2021 | $2,478 | $196,754 | $78,700 | $118,054 |
| 2020 | $2,499 | $194,738 | $77,894 | $116,844 |
| 2019 | $2,408 | $190,920 | $76,367 | $114,553 |
| 2018 | $2,376 | $187,177 | $74,870 | $112,307 |
| 2016 | $2,260 | $179,910 | $71,963 | $107,947 |
| 2015 | $2,228 | $177,209 | $70,883 | $106,326 |
| 2014 | $2,242 | $173,739 | $69,495 | $104,244 |
Source: Public Records
Map
Nearby Homes
- 17900 Sherman Way Unit 226
- 7333 Jamieson Ave
- 7322 Lindley Ave
- 7447 Enfield Ave
- 6941 Newcastle Ave
- 6923 Enfield Ave
- 6930 Balcom Ave
- 17522 Sherman Way Unit 204
- 18003 Saticoy St
- 7402 Nestle Ave
- 7044 Nestle Ave
- 7434 Nestle Ave
- 17447 Enadia Way
- 18149 Saticoy St
- 7000 Etiwanda Ave
- 7630 Jellico Ave
- 17419 Leadwell St
- 17431 Valerio St
- 7001 Bianca Ave
- 18319 Hart St Unit 3
- 17853 Sherman Way
- 17853 Sherman Way Unit 6
- 17853 Sherman Way Unit 5
- 17853 Sherman Way Unit 3
- 17853 Sherman Way Unit 2
- 17853 Sherman Way Unit 1
- 17853 Sherman Way Unit 10
- 17853 Sherman Way Unit 9
- 17853 Sherman Way Unit 8
- 17853 Sherman Way Unit 7
- 17845 Sherman Way Unit 15
- 17845 Sherman Way Unit 8
- 17845 Sherman Way Unit 10
- 17845 Sherman Way Unit 11
- 17845 Sherman Way Unit 12
- 7218 Zelzah Ave
- 7213 Zelzah Ave
- 7211 Zelzah Ave
- 7209 Zelzah Ave
- 7205 Zelzah Ave
Your Personal Tour Guide
Ask me questions while you tour the home.