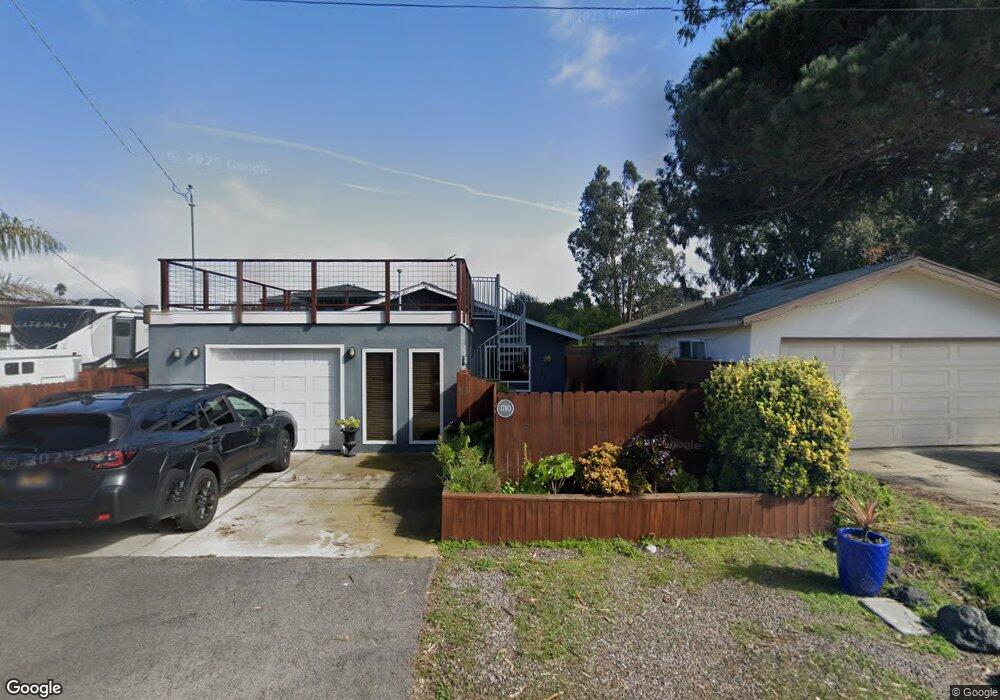
1786 Fearn Ave Los Osos, CA 93402
Estimated Value: $615,292 - $808,000
2
Beds
2
Baths
900
Sq Ft
$803/Sq Ft
Est. Value
About This Home
This home is located at 1786 Fearn Ave, Los Osos, CA 93402 and is currently estimated at $722,823, approximately $803 per square foot. 1786 Fearn Ave is a home located in San Luis Obispo County with nearby schools including Monarch Grove Elementary School, Los Osos Middle School, and Morro Bay High School.
Ownership History
Date
Name
Owned For
Owner Type
Purchase Details
Closed on
Jul 6, 2017
Sold by
Weir Holly Deborah and Weir Holly D
Bought by
Weir Holly D
Current Estimated Value
Purchase Details
Closed on
Mar 20, 2017
Sold by
Weir Robert G and Weir Kelley M
Bought by
Weir Robert G and Weir Kelley M
Purchase Details
Closed on
Dec 9, 2005
Sold by
Weir Holly D
Bought by
Weir Holly Deborah and Weir Robert Gerald
Create a Home Valuation Report for This Property
The Home Valuation Report is an in-depth analysis detailing your home's value as well as a comparison with similar homes in the area
Home Values in the Area
Average Home Value in this Area
Purchase History
| Date | Buyer | Sale Price | Title Company |
|---|---|---|---|
| Weir Holly D | -- | None Available | |
| Weir Robert G | -- | None Available | |
| Weir Robert G | -- | None Available | |
| Weir Holly Deborah | -- | None Available |
Source: Public Records
Tax History Compared to Growth
Tax History
| Year | Tax Paid | Tax Assessment Tax Assessment Total Assessment is a certain percentage of the fair market value that is determined by local assessors to be the total taxable value of land and additions on the property. | Land | Improvement |
|---|---|---|---|---|
| 2025 | $3,185 | $53,886 | $13,459 | $40,427 |
| 2024 | $3,182 | $52,831 | $13,196 | $39,635 |
| 2023 | $3,182 | $51,796 | $12,938 | $38,858 |
| 2022 | $3,049 | $50,782 | $12,685 | $38,097 |
| 2021 | $2,875 | $49,787 | $12,437 | $37,350 |
| 2020 | $2,529 | $49,278 | $12,310 | $36,968 |
| 2019 | $2,475 | $48,313 | $12,069 | $36,244 |
| 2018 | $2,415 | $47,367 | $11,833 | $35,534 |
| 2017 | $2,572 | $46,439 | $11,601 | $34,838 |
| 2016 | $1,302 | $45,529 | $11,374 | $34,155 |
| 2015 | $1,293 | $44,846 | $11,204 | $33,642 |
| 2014 | $1,251 | $43,968 | $10,985 | $32,983 |
Source: Public Records
Map
Nearby Homes
- 495 Ramona Ave
- 305 Henrietta Ave
- 0 Ash St
- 1840 Pine Ave
- 1830 Pine Ave
- 0 Garden St
- 2045 Pine Ave
- 332 Grove St
- 633 Ramona Ave Unit 24
- 1745 Doris Ave
- 480 Skyline Dr
- 1658 5th St
- 224 Butte Dr
- 409 Manzanita Dr
- 532 Mar Vista Dr
- 1412 5th St
- 1420 5th St
- 449 Mar Vista Dr
- 0 3rd St Unit SC25153823
- 971 Ramona Ave