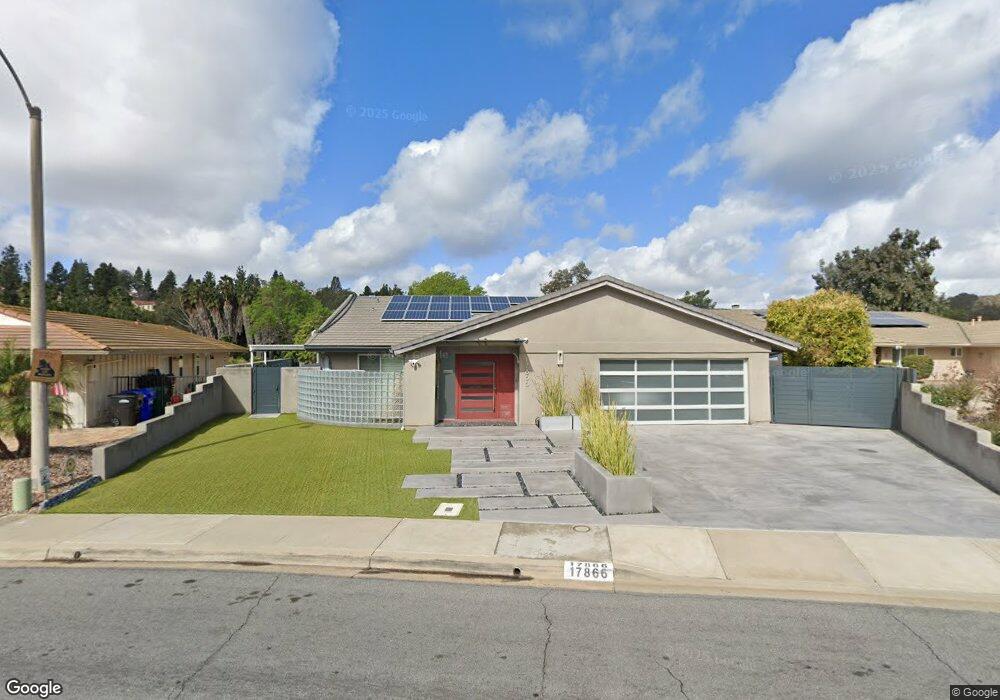
17866 Via Alta Mirasol San Diego, CA 92128
Rancho Bernardo NeighborhoodEstimated Value: $1,424,000 - $1,636,000
3
Beds
3
Baths
2,191
Sq Ft
$703/Sq Ft
Est. Value
About This Home
This home is located at 17866 Via Alta Mirasol, San Diego, CA 92128 and is currently estimated at $1,540,043, approximately $702 per square foot. 17866 Via Alta Mirasol is a home located in San Diego County with nearby schools including Chaparral Elementary, Bernardo Heights Middle, and Rancho Bernardo High.
Ownership History
Date
Name
Owned For
Owner Type
Purchase Details
Closed on
Mar 8, 2001
Sold by
Welch Tim
Bought by
Lavallart Franck and Lavallart Kaina
Current Estimated Value
Home Financials for this Owner
Home Financials are based on the most recent Mortgage that was taken out on this home.
Original Mortgage
$308,000
Outstanding Balance
$111,732
Interest Rate
6.97%
Estimated Equity
$1,428,311
Purchase Details
Closed on
May 17, 1995
Sold by
Welch Cooper F and Welch Betty L
Bought by
Weclh Cooper F and Welch Betty L
Purchase Details
Closed on
May 17, 1993
Purchase Details
Closed on
Jan 30, 1991
Purchase Details
Closed on
May 6, 1987
Purchase Details
Closed on
May 6, 1983
Create a Home Valuation Report for This Property
The Home Valuation Report is an in-depth analysis detailing your home's value as well as a comparison with similar homes in the area
Home Values in the Area
Average Home Value in this Area
Purchase History
| Date | Buyer | Sale Price | Title Company |
|---|---|---|---|
| Lavallart Franck | $385,000 | Fidelity National Title | |
| Weclh Cooper F | -- | -- | |
| -- | $272,000 | -- | |
| -- | $289,000 | -- | |
| -- | $250,000 | -- | |
| -- | $217,000 | -- |
Source: Public Records
Mortgage History
| Date | Status | Borrower | Loan Amount |
|---|---|---|---|
| Open | Lavallart Franck | $308,000 | |
| Closed | Lavallart Franck | $38,500 |
Source: Public Records
Tax History Compared to Growth
Tax History
| Year | Tax Paid | Tax Assessment Tax Assessment Total Assessment is a certain percentage of the fair market value that is determined by local assessors to be the total taxable value of land and additions on the property. | Land | Improvement |
|---|---|---|---|---|
| 2025 | $7,999 | $726,934 | $382,389 | $344,545 |
| 2024 | $7,999 | $712,682 | $374,892 | $337,790 |
| 2023 | $7,828 | $698,709 | $367,542 | $331,167 |
| 2022 | $7,697 | $685,010 | $360,336 | $324,674 |
| 2021 | $7,595 | $671,579 | $353,271 | $318,308 |
| 2020 | $7,492 | $664,694 | $349,649 | $315,045 |
| 2019 | $7,296 | $651,662 | $342,794 | $308,868 |
| 2018 | $7,090 | $638,885 | $336,073 | $302,812 |
| 2017 | $83 | $621,457 | $324,582 | $296,875 |
| 2016 | $6,704 | $609,272 | $318,218 | $291,054 |
| 2015 | $6,604 | $600,122 | $313,439 | $286,683 |
| 2014 | $5,732 | $523,368 | $307,300 | $216,068 |
Source: Public Records
Map
Nearby Homes
- 12022 Versailles Ct
- 17975 Caminito Pinero Unit 293
- 17865 Caminito Pinero Unit 251
- 17925 Caminito Pinero Unit 270
- 17885 Caminito Pinero Unit 255
- 17617 Pomerado Rd Unit 213
- 12516 Camino Vuelo
- 11915 Fairhope Rd
- 11820 Caminito Ronaldo Unit 222
- 11855 Caminito Ronaldo Unit 108
- 12505 Oaks Dr N Unit 141
- 12580 Oaks North Dr Unit 12
- 18197 Valladares Dr
- 12575 Oaks Dr N Unit 220
- 18304 Vezelay Ln
- 12565 Oaks North Dr Unit 115
- 17461 Plaza Abierto Unit 22
- 17924 Cabela Dr
- 17473 Plaza Abierto Unit 30
- 14320 Savannah Ct
- 17878 Via Alta Mirasol
- 17854 Via Alta Mirasol
- 17890 Via Alta Mirasol
- 17864 Via Gracia
- 17842 Via Alta Mirasol
- 17882 Via Gracia
- 17910 Mirasol Dr
- 17840 Via Gracia
- 17920 Mirasol Dr
- 17890 Via Gracia
- 17830 Via Alta Mirasol
- 17828 Via Gracia
- 17930 Mirasol Dr
- 17876 Via Altiva
- 17818 Via Alta Mirasol
- 17888 Via Altiva
- 17842 Via Altiva
- 17897 Mirasol Dr
- 17810 Via Gracia
- 17927 Mirasol Dr