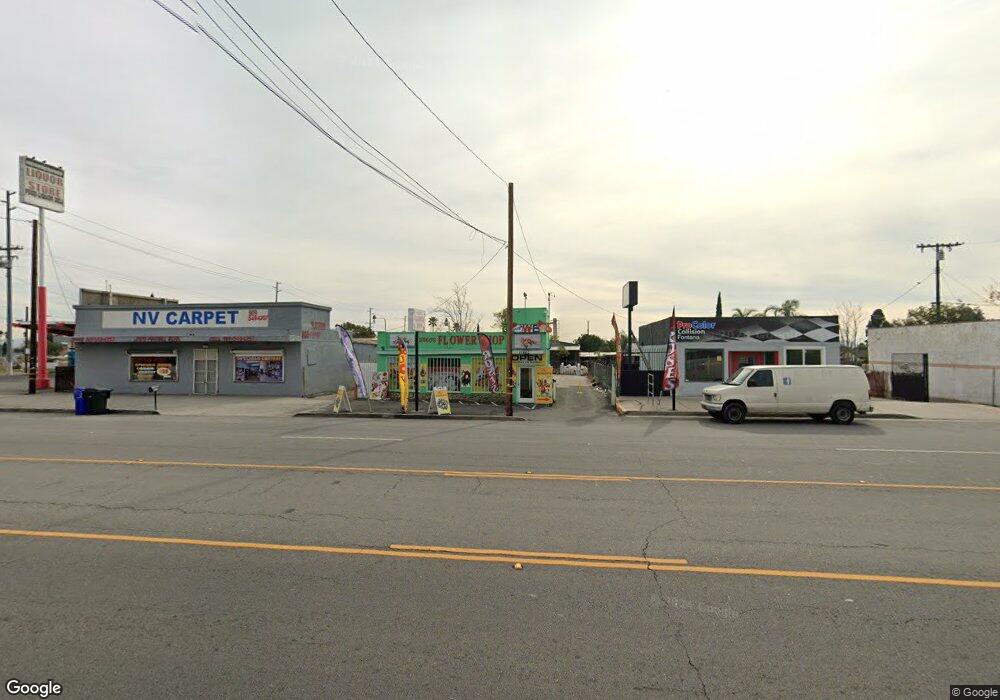
17867 Foothill Blvd Fontana, CA 92335
Estimated Value: $356,140
--
Bed
--
Bath
1,486
Sq Ft
$240/Sq Ft
Est. Value
About This Home
This home is located at 17867 Foothill Blvd, Fontana, CA 92335 and is currently estimated at $356,140, approximately $239 per square foot. 17867 Foothill Blvd is a home located in San Bernardino County with nearby schools including Ted Porter Elementary School, Alder Middle School, and Fontana High School.
Ownership History
Date
Name
Owned For
Owner Type
Purchase Details
Closed on
Mar 5, 2024
Sold by
Salcedo Victor Hugo
Bought by
Victor & Ana Revocable Living Trust and Salcedo
Current Estimated Value
Purchase Details
Closed on
Jul 16, 2012
Sold by
Baber Derrick H and Baber Steven R
Bought by
Salcedo Victor Hugo
Purchase Details
Closed on
Nov 20, 2003
Sold by
Clark Barbara
Bought by
Baber Hail
Purchase Details
Closed on
Oct 2, 2003
Sold by
Baber Hail
Bought by
Baber Hail Henderson and Baber Family Trust
Purchase Details
Closed on
Oct 8, 1993
Sold by
Salabaj John O and Salabaj Karen L
Bought by
Baber Hail
Home Financials for this Owner
Home Financials are based on the most recent Mortgage that was taken out on this home.
Original Mortgage
$10,000
Interest Rate
7.09%
Mortgage Type
Seller Take Back
Create a Home Valuation Report for This Property
The Home Valuation Report is an in-depth analysis detailing your home's value as well as a comparison with similar homes in the area
Home Values in the Area
Average Home Value in this Area
Purchase History
| Date | Buyer | Sale Price | Title Company |
|---|---|---|---|
| Victor & Ana Revocable Living Trust | -- | None Listed On Document | |
| Salcedo Victor Hugo | $110,000 | Ticor Title Company | |
| Baber Hail | -- | -- | |
| Baber Hail Henderson | -- | -- | |
| Baber Hail | $80,000 | Chicago Title Insurance Comp |
Source: Public Records
Mortgage History
| Date | Status | Borrower | Loan Amount |
|---|---|---|---|
| Previous Owner | Baber Hail | $10,000 |
Source: Public Records
Tax History Compared to Growth
Tax History
| Year | Tax Paid | Tax Assessment Tax Assessment Total Assessment is a certain percentage of the fair market value that is determined by local assessors to be the total taxable value of land and additions on the property. | Land | Improvement |
|---|---|---|---|---|
| 2025 | $1,420 | $135,456 | $61,571 | $73,885 |
| 2024 | $1,420 | $132,800 | $60,364 | $72,436 |
| 2023 | $1,383 | $130,196 | $59,180 | $71,016 |
| 2022 | $1,378 | $127,644 | $58,020 | $69,624 |
| 2021 | $1,361 | $125,141 | $56,882 | $68,259 |
| 2020 | $1,358 | $123,858 | $56,299 | $67,559 |
| 2019 | $1,317 | $121,429 | $55,195 | $66,234 |
| 2018 | $1,337 | $119,048 | $54,113 | $64,935 |
| 2017 | $1,329 | $116,714 | $53,052 | $63,662 |
| 2016 | $1,307 | $114,426 | $52,012 | $62,414 |
| 2015 | $1,291 | $112,707 | $51,231 | $61,476 |
| 2014 | $1,292 | $110,499 | $50,227 | $60,272 |
Source: Public Records
Map
Nearby Homes
- 17848 17858 Foothill Blvd
- 18045 Foothill Blvd
- 8019 Alder Ave
- 17721 Upland Ave
- 17655 Vine Ct
- 7936 Alder Ave
- 7925 Spohn Ave
- 7870 Williams Rd
- 17562 Court St
- 7724 Myles Ct
- 18013 Arrow Blvd
- 17442 Vine St
- 357 N Maple Ave
- 17548 Court St
- 8560 Buckeye Dr
- 18100 Arrow Blvd
- 7740 Lombardy Ave
- 17425 Upland Ave
- 17392 Paine St
- 250 N Linden Ave Unit 124
- 17875 Foothill Blvd
- 17851 Foothill Blvd
- 8142 Laurel Ave
- 17901 Foothill Blvd
- 17905 Foothill Blvd
- 17860 Vine St
- 17870 Vine St
- 8172 Laurel Ave
- 17850 Vine St
- 17840 Vine St
- 17830 Vine St
- 17880 Vine St
- 17904 Foothill Blvd
- 17820 Vine St
- 8145 Laurel Ave
- 17914 Foothill Blvd
- 17810 Vine St
- 8071 Laurel Ave
- 17885 Vine St
- 8155 Laurel Ave