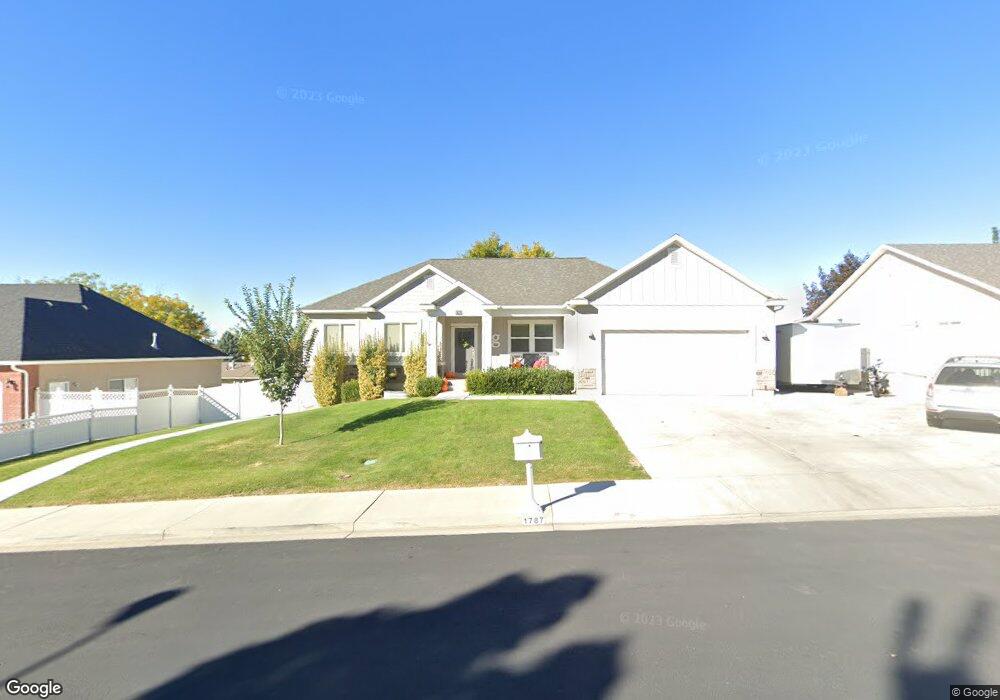
1787 N 1950 W Provo, UT 84604
Grandview North NeighborhoodEstimated Value: $619,000 - $754,000
3
Beds
3
Baths
1,678
Sq Ft
$414/Sq Ft
Est. Value
About This Home
This home is located at 1787 N 1950 W, Provo, UT 84604 and is currently estimated at $695,190, approximately $414 per square foot. 1787 N 1950 W is a home with nearby schools including Westridge Elementary School, Dixon Middle School, and Provo High School.
Ownership History
Date
Name
Owned For
Owner Type
Purchase Details
Closed on
May 29, 2018
Sold by
Simkins Slade
Bought by
Gordon Darin
Current Estimated Value
Home Financials for this Owner
Home Financials are based on the most recent Mortgage that was taken out on this home.
Original Mortgage
$426,550
Outstanding Balance
$368,060
Interest Rate
4.4%
Mortgage Type
New Conventional
Estimated Equity
$327,130
Purchase Details
Closed on
May 17, 2012
Sold by
Simkins Kathy R
Bought by
Simkins Slade
Home Financials for this Owner
Home Financials are based on the most recent Mortgage that was taken out on this home.
Original Mortgage
$296,933
Interest Rate
3.98%
Mortgage Type
Construction
Purchase Details
Closed on
May 13, 2011
Sold by
Simkins Kathy R
Bought by
Simkins Kathy R
Purchase Details
Closed on
Feb 17, 1998
Sold by
Trost Philip A and Trost Janet
Bought by
Simkins Kathy R
Purchase Details
Closed on
Mar 5, 1997
Sold by
Vanburen Construction Inc
Bought by
Trost Philip A and Trost Janet
Create a Home Valuation Report for This Property
The Home Valuation Report is an in-depth analysis detailing your home's value as well as a comparison with similar homes in the area
Home Values in the Area
Average Home Value in this Area
Purchase History
| Date | Buyer | Sale Price | Title Company |
|---|---|---|---|
| Gordon Darin | -- | United West Title | |
| Simkins Slade | -- | None Available | |
| Simkins Kathy R | -- | None Available | |
| Simkins Kathy R | -- | -- | |
| Trost Philip A | -- | -- | |
| Vanburen Construction Inc | -- | -- |
Source: Public Records
Mortgage History
| Date | Status | Borrower | Loan Amount |
|---|---|---|---|
| Open | Gordon Darin | $426,550 | |
| Previous Owner | Simkins Slade | $296,933 |
Source: Public Records
Tax History Compared to Growth
Tax History
| Year | Tax Paid | Tax Assessment Tax Assessment Total Assessment is a certain percentage of the fair market value that is determined by local assessors to be the total taxable value of land and additions on the property. | Land | Improvement |
|---|---|---|---|---|
| 2025 | $3,458 | $370,535 | $279,500 | $394,200 |
| 2024 | $3,458 | $340,395 | $0 | $0 |
| 2023 | $3,530 | $342,595 | $0 | $0 |
| 2022 | $3,435 | $336,105 | $0 | $0 |
| 2021 | $2,851 | $486,600 | $218,300 | $268,300 |
| 2020 | $2,783 | $445,300 | $189,800 | $255,500 |
| 2019 | $2,610 | $434,300 | $189,800 | $244,500 |
| 2018 | $2,276 | $384,100 | $171,500 | $212,600 |
| 2017 | $2,214 | $205,260 | $0 | $0 |
| 2016 | $2,352 | $203,225 | $0 | $0 |
| 2015 | $2,313 | $202,015 | $0 | $0 |
| 2014 | $2,144 | $195,250 | $0 | $0 |
Source: Public Records
Map
Nearby Homes